
Use available analytics to better understand your email performance and audience.
Recommendation: Review email performance 5 to 7 days after sending.
Waiting 5 to 7 days after an email is sent gives recipients enough time to open, read, and engage with your message, resulting in more complete and reliable data. Reviewing too early can lead to incomplete insights and misinformed decisions, since engagement often continues several days after the initial send.
Analytics are available within Email Studio of Marketing Cloud where you can view and export data as needed.
How To: View Email Tracking
- From the Marketing Cloud Email Studio, click on the Tracking tab in the top navigation bar.
- Click Sends from the drop down menu. On the left side pane, a folder structure will be visible displaying tracking reports for emails in a given folder. In the middle pane, the files within the selected folder are displayed.
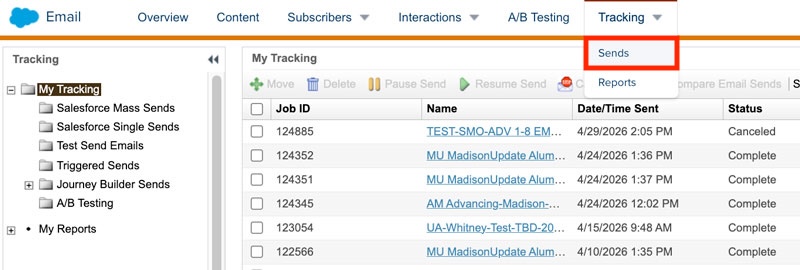
- Click on the email file name to view it's tracking report. In the report's Overview tab, different performance cards are visible:
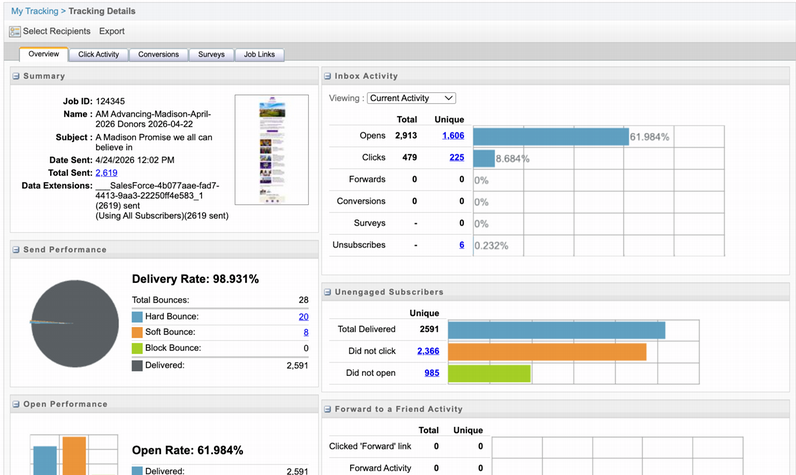
- Summary shows details about the email, including the subject line, date sent, total emails sent, and data extensions or campaigns used.
- Inbox activity shows the total and unique numbers and rates for key metrics.
- Send performance shows delivery and bounce rates.
- Unengaged subscribers lists how many people did NOT open the email and how many did NOT click on links within the email.
- Open performance shows open rates and totals.
- From the Overview tab, you can click Export at the top to download performance data as a PDF or Excel spreadsheet.
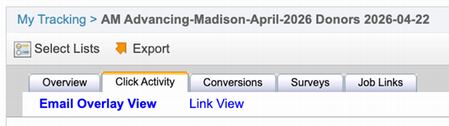
- Select the Click Activity tab to gain insight into how your audience interacts with links in your message. You'll see the ability to view this data as overlay to the email or as a link view.
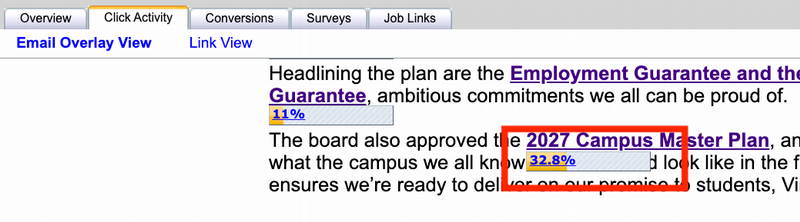
- Email Overlay View shows a preview of the email message with each link and a percent of total clicks that the link received. For example, in the screenshot below, 32.8% of all clicks in the email were to "2027 Campus Master Plan".
- Link View shows a list of link alias names and their engagement metrics. Link alias names are generated when you make a link. (Aliases should be unique to help distinguish between different links that use the same link text in your email.)
- Email Overlay View shows a preview of the email message with each link and a percent of total clicks that the link received. For example, in the screenshot below, 32.8% of all clicks in the email were to "2027 Campus Master Plan".
To do your own email performance analysis, use this interactive report (valid for emails sent through the Advancement Business Unit).
Please Note:
- The report by default shows all emails in the previous quarter, however the date range can be changed
- The report will not show emails sent in the current month, as this data is not yet available. On the 5th of every month, data for the previous month is added to this interactive report.
Using the Report:
- Filter data by using the purple boxes at the top so that you only see what you want to see.
- We suggest filtering by "Category" and date, but you can also filter by the email name and by number of emails sent.
- You can also sort by any column by clicking on the column heading. Clicking it again will sort in the opposite direction.

Analysis Tips:
The interactive report can be used to answer some important questions about your email's performance:
Sort by "Unique Click %", with the highest values at the top, then ask, "What emails performed best in terms of click rate?"
Unique Click % measures the percentage of individual repicients who clicked at least one link in your email and is related to the effectiveness of your email AFTER it is opened. It is a strong indicator of audience engagement and is not inflated by repeated clicks. It can answer the question, "How many people were actually engaged enough to click?".
With "Unique Click %" you also need to be careful about comparing unlike emails to each other. Some content is going to be inherently more engaging than other content (ie. don't compare click rates in an email about entering to win a prize with an email about taking a survey.)

Hours of Operation:
Mon - Fri 8 a.m. - 5 p.m.