
Data Tables consist of tabular fields in a grid-like format so that these fields can easily be compared with one another. These tables are used extensively in the digital sphere to cleanly organize raw data, convey trends, etc.
Layout tables are tables that are used solely for the purposes of organization and layout. For example, someone may use a table to organize a list of items into two columns.
When using tables, determine whether it’s a true table (data table) or table being used for presentational purposes (layout table). Avoid layout tables for arranging content, as they can cause accessibility issues. Other methods are often better for providing visual organization of content.
Expectations
Data tables must convey all visual information programmatically. Table headings should be visibly apparent using font attributes like boldface, alignment, etc. If a table heading is visually apparent or inferable, it must have this designation represented programmatically as well. This means that the following must be covered correctly in code:
- Table headings (including nested headings and their relationship to main headings)
- Data Cells (including their relationship to all headings they fall under)
A brief description/summary of the table should be provided in a table caption.
Images of tables must not be used, as all common file formats provide methods to reliably recreate a table.
Alternating row colors (“banding”) and shaded headers are frequently used to make data tables easier to read. However, one must ensure color contrast meets accessibility standards and that tables don’t rely on color alone to convey information. Text and cell borders must also have sufficient contrast with their backgrounds. See: Color Contrast and Color Reliance
Layout tables should not be used. Using a layout table for organization will often break other success criteria in the process. Use other methods for clean organization rather than tables. For example, set a list as a two-column section of text rather than using a table to accomplish the same presentation.
Why Accessible Tables are Important
Table structure is critical to understanding and analyzing the data inside:
- Without clear, visual styling of cell and row headers, the audience is less likely to understand the purpose of the table itself. The impact of an unorganized, visually unclear table can have a compounding effect on audience members with cognitive disabilities.
- Low color contrast can impact those with color blindness or other visual impairments, obscuring text and cell boundaries.
- Correct programmatic relationships allow audience members who use certain assistive technologies like screen readers to fully engage with tables.
How To Implement
How to create an accessible table depends on two things: the table’s layout and the tool you’re using (e.g., HTML, Word, LaTeX). Some tools allow more control for complex tables, while others don’t — in some cases, you may need to reformat the table.
Quick Tips:
- Keep it simple. Use plain, unmerged cells and avoid complex layouts or nested tables.
- Use headers properly. Identify column and/or row headers using built-in table header tools (not just bold text).
- Include a table title or caption. Briefly describe what the table shows.
- Maintain reading order. Ensure table reads logically left-to-right and top-to-bottom.
- Don’t rely on color alone. Use text or symbols in addition to color to convey meaning.
- Ensure good contrast. Text and cell borders must have sufficient contrast with the background.
How to: Create Accessible Tables
The following instructions outline best practices for creating accessible tables across different platforms.
HTML offers the highest level of granularity for recreating both simple and complex tables. Depending on the type of table, relationships between table elements utilize some of the following components:
- The
<th>(table heading) element. Used for both column and row headings. - The
<colgroup>element. - The
“scope”attribute, with the corresponding “col”, “row”, “colgroup,” or “rowgroup” value. - The “headers” attribute and associated heading id values. Note: This method is strongly discouraged due to its difficulty to produce and strong chance for human error. We recommend reformatting the table in these cases instead.
Detailed information and examples for various table types can be found on W3C’s WAI Initiative – Tables Tutorial page.
Cascade: In addition to adding HTML tables to WYSIWYG content areas, a special datatable block can be added to Cascade webpaegs. The Cascade datatable block configuration allows for additional formatting and usability features, such as sorting, search, and alternating row colors. See: Datatables in Cascade.
In LaTeX, the “accessibility” package combined with correct mark-up for headers and data cells will produce more accessible PDF outputs. This said, as of writing, these PDF outputs are non-compliant if they have math in them. Further, conversion from LaTeX to HTML via Pandoc will not necessarily produce accessible tables even if the accessibility package is used.
If your table consists of only one row of column headings, it likely needs no remediation as a PDF or as a converted webpage (from Pandoc). For any table with row headings or nested headings, remediation will need to be performed in either Adobe Pro or HTML.
MS Excel performs best as a program for data analytics and computation. While counterintuitive, you may want to use another program other than Excel if you are using it solely to present a table with no need for further analytics. In this case, opt to use another program such as MS Word.
If the analytic components are needed in Excel and a table is present, take the following steps to ensure compliance. At the time of writing, this method maintains relationships as tested with JAWS, NVDA, and VoiceOver on desktop machines:
-
Do not use merged or split cells in MS Excel. Unfortunately, MS Excel does not support nested or multi-level headings. Ensure that your table only has one row of column headings and one column of row headings at most. Please see “Simplifying Tables” for tips on how to reformat tables.
-
Ensure your data is formatted as a table. To do this, select all of the cells that make up your table. Go to the “Insert” tab and click “Table” in the ribbon. In the resulting pop-up, ensure that “My table has headers” is checked if your document has column headers. Click “OK".
-
Verify your table headers are identified. With your table selected, click “Table Design" in the Ribbon. If you selected “My table has headers” in the previous step, the “Header Row” box should already be checked in the “Table Style Options” section. If your table has row headers, make sure that “First Column” is also selected.
-
Define names for your headers:
-
If your table has column headers, select them all. Click “Formulas” in the ribbon and then click “Define Name” in the “Defined Names” section of the ribbon. Type “ColumnTitle” in the “Name.” This name can be followed by any specifier if there are multiple tables in the same sheet, but must begin with “ColumnTitle.” E.g. “ColumnTitle_Region1.” Ensure “Scope” is set to the current sheet. Click “OK.”
-
If your table has row headers, select them all. Click “Formulas” and then click “Define Name” in the “Defined Names” section of the ribbon. Type “RowTitle” in the “Name.” This name can be followed by any specifier if there are multiple tables in the same sheet, but must begin with “RowTitle.” E.g. “RowTitle_Region1.” Ensure “Scope” is set to the current sheet. Click “OK.”
-
- Ensure that colors used meet color contrast guidelines. Not all of the availalbe table styling options within Excel meet the contrast requirements for text and background colors. Learn more about color contrast.
-
Repeat these steps as necessary for each table. Save your document.
- Do not use merged or split cells.
Unfortunately, MS Word does not support nested or multi-level headings. Ensure that your table only has one row of column headings and one column of row headings at the most. Please see “Simplifying Tables” section for tips on how to reformat tables. - Identify table Headings properly according to structure.
Depending on the structure of your table (see examples A-C below), you will need to adjust the "Table Style Options" in the Table Design ribbon to identify the Headings for your table.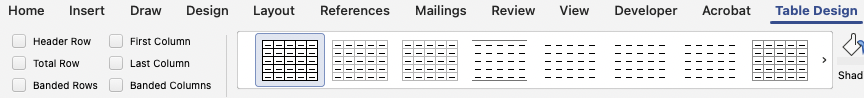
- 1 row of column headings: Ensure that "Header Row" is checked if your table contains ONLY one row of column headings.
Example: Table with one row of column headings. Column A Column B Column C A1 B1 C1 A2 B2 C2 - 1 column of row headings: Ensure that "First Column" is checked if your table contains ONLY one column of row headings.
Example: Table with one column of row headings. Row 1 A1 B1 C1 Row 2 A2 B2 C2 Row 3 A3 B3 C3 - BOTH 1 row of column headings AND 1 column of row headings: Ensure that BOTH “Header Row” and “First Column” are checked if your table contains both row and column headings.
Example: Table with BOTH one row of column headings AND one column of row headings. Column A Column B Column C Row 1 A1 B1 C1 Row 2 A2 B2 C2 Row 3 A3 B3 C3
- 1 row of column headings: Ensure that "Header Row" is checked if your table contains ONLY one row of column headings.
- Ensure that colors used meet color contrast guidelines.
Not all of the availalbe table styling options meet the contrast requirements for text and background colors. Learn more about color contrast. - Repeat table headings at the top of each page (if necessary)
Table headings cannot break across pages and should be repeated at the top of each page (if the table requires more than one page). To do this, select your heading row, right click, and select “Table Properties.” Here, select the “Row” tab. Make sure that “Allow row to break across pages” is unselected and that “Repeat as header row at the top of each page” is selected.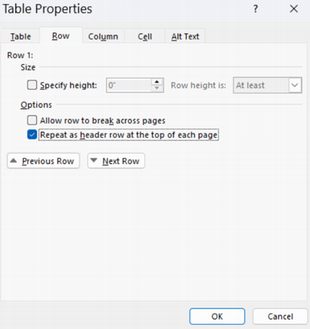
PDF documents use their own unique tagging structure. PDF accessibility is outlined in Adobe’s most recent edition of ISO 32000-1 (PDF/UA) and ISO 32000-1(Document management — Portable document format). These standards can be accessed through JMU’s licensed database “TeachStreet.”
For practical how-to guides on accessible PDF production and remediation, we recommend Chad Chelius’s “Accessible PDF” course available to the JMU community on LinkedIn Learning.
Simplifying Tables
Complex data tables should be simplified for accessibility because complex layouts can confuse assistive technologies and make data hard to understand. Additionally, other methods to display information should be considered to ensure the content is understandable and accessible to all users. In some instances, this may mean not using a table.
Consider the following examples for simplifying complex data tables and presenting information in a different way.
It may be necessary to simplify and split complex tables to ensure compliance. Consider the following table with nested column and row headers:
| Beans | Tubers | ||||
|---|---|---|---|---|---|
| Navya | Limab | Potatoc | Cassavad | ||
| Carbohydrates | Dietary Fiber | 19g | 13g | 3.8g | 3.7g |
| Sugars | 0.7g | 5.5g | 2g | 3.5g | |
| Fats | Saturated | 0.7g | 5.5g | 2g | 3.5g |
| Trans | 0g | 0g | 0g | 0g | |
| Polyunsaturated | 0.9g | 0.3g | 0.1g | 0.1g | |
| Monounsaturated | 0.3g | 0.1g | 0g | 0.2g | |
Sources:
- a per cup. https://www.nutritionix.com/food/navy-beans
- b per cup. https://www.nutritionix.com/food/lima-beans
- c per medium potato. https://www.nutritionix.com/food/potato
- d per cup. https://www.nutritionix.com/food/cassava
This complex table could be simlified using two methods:
- Column headers: Combine the main and subheaders into one cell (best for short headers).
- Row headers: Split the table by main header and include it as a caption or as a heading above the table.
| Beans: Navya | Beans: Limab | Tubers: Potatoc | Tubers: Cassavad | |
|---|---|---|---|---|
| Dietary Fiber | 19g | 13g | 3.8g | 3.7g |
| Sugars | 0.7g | 5.5g | 2g | 3.5g |
| Beans: Navya | Beans: Limab | Tubers: Potatoc | Tubers: Cassavad | |
| Saturated | 0.7g | 5.5g | 2g | 3.5g |
|---|---|---|---|---|
| Trans | 0g | 0g | 0g | 0g |
| Polyunsaturated | 0.9g | 0.3g | 0.1g | 0.1g |
| Monounsaturated | 0.3g | 0.1g | 0g | 0.2g |
Layout tables, tables used solely for visual presentation, should be reformatted into plain text. Consider the following example where a table is being used to display a list of indoor plants:
|
|
Using a table to create a two-column list breaks accessibility compliance. In this case, a single list is broken into two programmatically despite visually being a single list. This is a violation of SC 1.3.1 Info and Relationships (Level A).
Instead of using this table to display this information in columns, we can achieve the same visual presentation as A) a long bulleted list, or B) a bulleted list with columns.
- Bulleted list:
- Aloe Vera
- Boston Fern (Nephrolepis exaltata)
- Cast Iron Plant (Aspidistra elatior)
- Chinese Evergreen (Aglaonema)
- English Ivy (Hedera helix)
- Jade Plant (Crassula ovata)
- Lucky Bamboo (Dracaena sanderiana)
- Parlor Palm (Chamaedorea elegans)
- Peace Lily (Spathiphyllum)
- Philodendron (Heartleaf variety)
- Pothos (Epipremnum aureum)
- Rubber Plant (Ficus elastica)
- Snake Plant (Sansevieria)
- Spider Plant (Chlorophytum comosum)
- ZZ Plant (Zamioculcas zamiifolia)
- Bulleted list with 2 columns: In HTML, a bulleted (or numbered) list can be displayed across multiple columns using the following syntax:
<ul style="columns: 2;"> (Note: In this example, 2 specifies the number of columns to display)- Aloe Vera
- Boston Fern (Nephrolepis exaltata)
- Cast Iron Plant (Aspidistra elatior)
- Chinese Evergreen (Aglaonema)
- English Ivy (Hedera helix)
- Jade Plant (Crassula ovata)
- Lucky Bamboo (Dracaena sanderiana)
- Parlor Palm (Chamaedorea elegans)
- Peace Lily (Spathiphyllum)
- Philodendron (Heartleaf variety)
- Pothos (Epipremnum aureum)
- Rubber Plant (Ficus elastica)
- Snake Plant (Sansevieria)
- Spider Plant (Chlorophytum comosum)
- ZZ Plant (Zamioculcas zamiifolia)
WCAG Success Criteria
Meeting all of the above requirements (must statements) ensures that data tables are in compliance with WCAG 2.1 (AA) as they relate to the following:
- SC 1.3.1 Info and Relationships (A)
- SC 1.4.1 Use of Color (A)
- SC 1.4.3 Contrast (Minimum) (AA)
- SC 1.4.5 Images of Text (AA)
Further, meeting all of the above recommendations (should statements) ensures that data tables are aligned with best practices as they relate to the following: