
The next two steps of the Assessment Cycle are critical. We must use a data collection design that supports the inferences we intend to make as specified by our student learning and development outcomes (SLOs). Then we must appropriately analyze the results to draw accurate conclusions. During these steps of the process, you will need to consider questions such as:
- Who or what do you want to make inferences about?
- Who will be assessed?
- What data collection design should be used based on your SLOs?
- When, where, and how will you collect the data?
- Are there threats to the validity of the inferences you want to make?
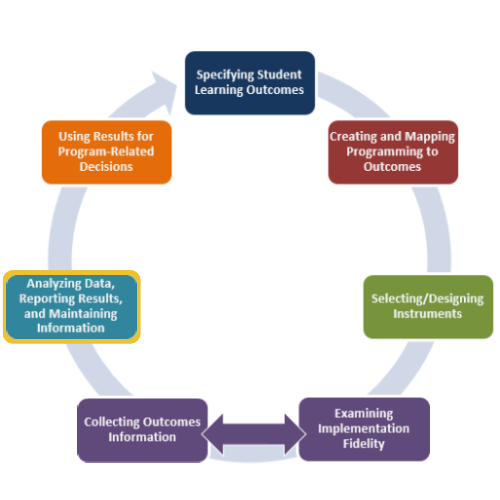
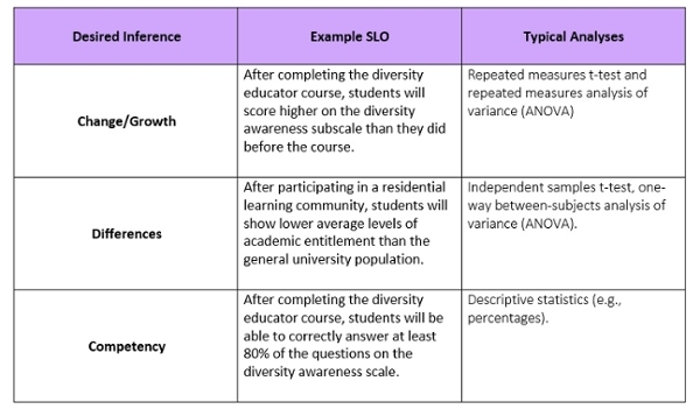
Match Between Desired Inferences, SLOs, and Analyses
Not only do your SLOs dictate the data collection design, but they also define the type of inferences you are able to make. For example, do you want to make inferences about group differences, student change/growth, relations between variables, or student competency? These types of inferences should be articulated in the SLOs. In addition, SLOs and inferences desired inform the type of analyses used to evaluate assessment results.
Threats to Validity
Validity refers to the degree to which evidence supports the intended interpretation of assessment results. There are several factors that can threaten the validity of the inferences we make from assessment results. Each data collection design either protects against or is susceptible to different threats to validity. Some of the most common threats to validity include:
Maturation Effect: The observed effect is due to students’ normal developmental processes or changes over time, not the program.
- Example: Program A (implemented during the first semester of college) claims to have increased students’ sense of independence. However, studies show students naturally gain more independence during their first semester of college even without an intervention.
Selection Bias: The observed difference between two groups at posttest is not due to the program, but to preexisting differences between the groups.
- Example: Facilitators of Program C compare students who participated in their service learning program to students who did not participate and are pleased to find that their students are higher in civic engagement—clear evidence that the program works! Upon further investigation, however, they discover that students high in civic engagement were more likely to participate in their program in the first place. Thus, the difference between the groups was due to self-selection into the program, not the program’s effectiveness.
Response Processes: Results cannot be trusted to reflect students’ true ability because they are impacted by things like socially desirable responding and low motivation.
- Example: After completing a 6-hour alcohol prevention workshop, students are fatigued and ready to leave. Unsurprisingly, when asked to complete a 100-item posttest (the only thing separating them from freedom) they speed through the test—responding randomly to the questions. Subsequent posttest results indicate students gained nothing from the workshop. Should these results be trusted?
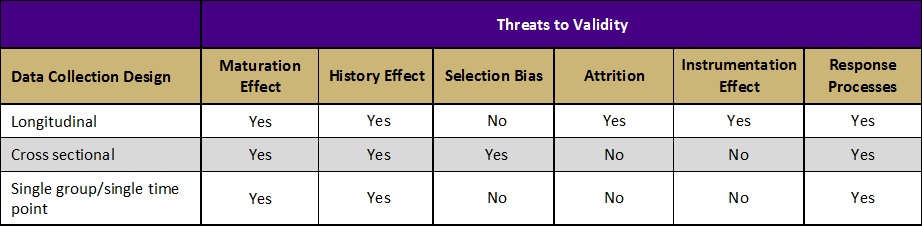
Learn more about the threats to validity outlined in the table above
Additional Resources
Video: Analyzing Student Learning Outcomes Data
Handout: Common Threats to Validity