
Computer Vision Detection of Explosive Ordnance: A High-Performance 9N235/9N210 Cluster Submunition Detector
Adam Harvey [ VFRAME ] and Emile LeBrun [ Tech 4 Tracing ]
CISR Journal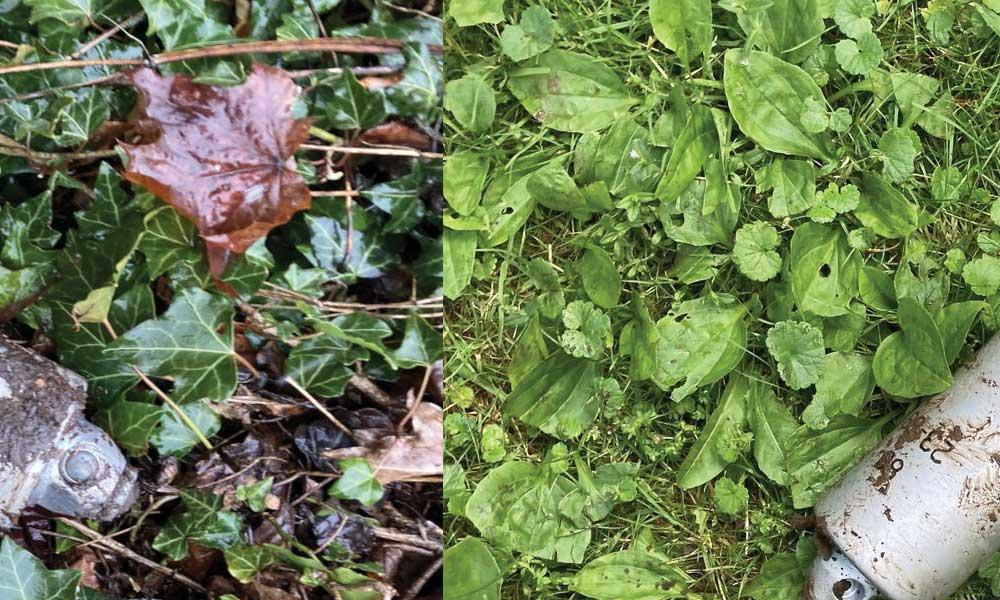
This article is brought to you by the Center for International Stabilization and Recovery (CISR) from issue 27.2 of The Journal of Conventional Weapons Destruction available on the JMU Scholarly Commons and Issuu.com
The detection of explosive ordnance (EO) objects is experiencing a period of innovation driven by the convergence of new technologies including artificial intelligence (AI) and machine learning, open-source intelligence (OSINT) processing, and remote mobility capabilities such as drones and robotics.1 Advances are being made on at least two tracks: in the automated searching of photographic image archives, and in the real-time detection of objects in the field.2 Different technologies are responsive to different types of EO detection challenges, such as objects that are buried, semi-buried, or partially damaged.
Computer vision—a type of artificial intelligence (AI) that enables computers and systems to derive meaningful information from digital images, videos, and other visual inputs, and take actions or make recommendations based on that information—is a promising AI technology that can greatly enhance humanitarian mine action (HMA), as well as support evidentiary documentation of the use of EO that are prohibited under international humanitarian law. This article describes a computer vision algorithm creation workflow developed to automate the detection of the 9N235/9N210 cluster submunition, a heavily deployed munition in the Ukraine conflict. The six-step process described here incorporates photography, photogrammetry, 3D-rendering, 3D-printing, and deep convolutional neural networks.3 The resulting high-performance detector can be deployed for searching and filtering images generated as part of OSINT investigations and soon, for real-time field detection objectives.
9N235/9N210 Submunition
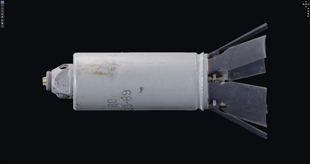
Figure 1. 3D visualization of finalized 9N235 photogrammetry model. Figure courtesy of Adam Harvey.
The 9N235 and 9N210 are nearly visually identical high-explosive fragmentation submunitions (i.e., the explosive elements of cargo rocket-delivered cluster munitions). Upon detonation, the explosive payload blasts metal fragments in all directions, indiscriminately killing or maiming bystanders, including non-combatant civilians. The munition has been widely documented in the Ukraine conflict.4 While neither Russia nor Ukraine are party to the Convention on Cluster Munitions,5 they are both bound by the Additional Protocol II of Geneva Conventions, which prohibits indiscriminate attacks.6
Based on these considerations, the distinctive visual appearance of the 9N235/9N210, and the fact that the object has a well-documented design flaw that leads to frequent failed detonation resulting in widespread unexploded ordnance (UXO) contamination,7 VFRAME selected the 9N235/9N210 as a candidate for object detection development.8 To test the hypothesis, we built and evaluated an object detector.
Building a Detector
The initial challenge for building a computer vision-based object detector for this munition was a lack of a sufficient number of diverse reference photographs of the object. While the number of online photographs of the 9N235/9N210 has increased in 2023, they still only reach the hundreds, with many duplicates. After splitting the remaining pool for training, validation, and test datasets, there is insufficient data for training a robust object detector.
An innovative approach to building neural networks using art-driven, data-centric development, developed by VFRAME, overcomes this challenge. Instead of scraping biased images online or setting up sterile laboratory experiments, data is generated from the ground-truth up using an interdisciplinary combination of photography, photogrammetry, 3D-rendering, 3D-printing, custom software, and artistic replication. Using this approach, a high-performance 9N235/9N210 detector was developed with almost no data from online sources, except for use in the final benchmarking dataset to evaluate the algorithm’s performance.
The first step bypasses the Internet as a source of data and instead uses access to the real submunition as the ground-truth source of data as a 3D model, using photogrammetry.
Step 1: Photogrammetry
Photogrammetry is the process of using multiple high-resolution photos to reconstruct an object’s 3D geometry and surface texture, via the structure from motion (SfM) technique. Creating 3D scan models of physical objects has become increasingly simplified over the last decade, but there are many trade-offs between different software, camera, and capture approaches. There are also dedicated handheld 3D scanners and smartphone devices that simplify the process further by integrating high-end depth sensors with on-device photogrammetry processing.9 There is no single best approach. For this project, the goals were high-accuracy, portability, and the ability to utilize existing hardware, in this case a digital single-lens reflex (DSLR) camera and graphics processing unit (GPU) workstation.
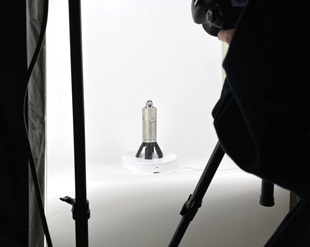 Figure 2. Capturing the original 9N235/9N210 submunition using photogrammetry with an automated turntable and DSLR camera. Courtesy of Adam Harvey. Figure 2. Capturing the original 9N235/9N210 submunition using photogrammetry with an automated turntable and DSLR camera. Courtesy of Adam Harvey. |
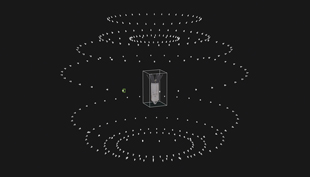 Figure 3. Photogrammetry scan of the 9N235 submunition by VFRAME in collaboration with Tech 4 Tracing. Courtesy of Adam Harvey. Figure 3. Photogrammetry scan of the 9N235 submunition by VFRAME in collaboration with Tech 4 Tracing. Courtesy of Adam Harvey. |
 Figure 4. Rendering. Courtesy of Adam Harvey. Figure 4. Rendering. Courtesy of Adam Harvey. |
The most important aspect is not the technology but finding safe access to a free-from-explosive (FFE) munition. The munition must be undamaged, as damaged areas will become part of the ground-truth geometry, representative of the object as it appears in conflict zones, and not significantly altered during the FFE conversion.
To access the 9N235/9N210 submunition, VFRAME partnered with Tech 4 Tracing, an international, non-profit partnership of arms control and new technology experts working to apply new technologies to arms and ammunition control.10 In the early spring of 2022, both teams traveled to an armed forces explosive ordnance disposal (EOD) center in Europe and carried out the photogrammetry capture. In total, about 200 high-resolution photos were used to create the 9N235/9N210 3D model using an automated turntable to expedite the process. Each marker in Figure 3 shows the camera position for each photo.
After post-processing the photos and completing the 3D reconstruction process, the final result is a sub-millimeter-accurate 3D model. This becomes an ideal ground truth for generating synthetic training data.

Figure 5. 3D-rendered image with a 9N235 submunition used in the training dataset. Courtesy of Adam Harvey.
Step 2: 3D Rendered Synthetic Data
Typically, training images for computer vision detection are gathered from online sources or from existing imaging systems, such as closed caption TV. Images are then manually annotated in-studio or outsourced to image annotation services in foreign countries. But this methodology creates multiple issues, among them data security, data bias, labor exploitation, cost, and the possibility of errors.
The use of synthetic data solves many of these problems because the annotations are automatically generated by software, diversity and bias can be controlled for, weather conditions can be programmed, and it can lower the overall cost. For these reasons, it is a transformative technology, especially for detecting rare and dangerous objects such as cluster submunitions. To develop the 9N235/9N210 synthetic training dataset, over 10,000 unique images were rendered using various lighting environments, scene compositions, dirt variations, damage variations, and camera lenses—each of which can be deliberately controlled. This is achieved using a custom software application based on the Blender 3D rendering software.
Figure 6. Auto-generated mask and bounding box values for training data. Courtesy of Adam Harvey.
Using synthetic image data, the way the object appears matches observations from the preliminary research: it reflects how the submunition lands, the material properties and weathering effects, and the terrain in which it is documented. Often, the submunition is lodged into a soft ground surface with all six of its black tail fins pointing upright. Sometimes the tail fins will break, leaving a metal tube with various permutations of one to six integral or partial fins visible, or none. These variables can also be modeled. But at some point, either through extensive damage or majority occlusions, the object is no longer integral and should not be detected, for example when only a minority of the metal is visible and with no fins. Controlling confidence levels for false positives is also important, especially for large-scale OSINT analyses.
The example images were rendered using a simulated 40mm lens on a DSLR type sensor with F5.6 aperture using afternoon lighting and center-focused on the 9N235 with all six fins intact. To improve diversity, every image is procedurally randomized and then manually reviewed to ensure the training data aligns with the expected outcomes. This is merely one of over 10,000 randomized training images created for the training dataset.
Step 3: 3D-Printed Synthetic Data
Figure 7. 3D printing multi-part 9N235 submunition replica for use in simulated benchmark photos and videos.Courtesy of Adam Harvey.
With enough work, 3D-rendered images can achieve convincing photorealism but still contain artifacts of a simulated world and risk overfitting if the target objects are too rigid or lack diversity, such as occlusions, corrosion, or observer biases. There is a growing field of research that explores how to bridge the gap between simulation and reality, also referred to as the domain gap. However, this approach assumes that the simulated or rendered world is significantly different from the “real” world. Instead, the VFRAME project employs the concept of mixed reality data and hybrid training based on the idea that all worlds contain artifacts, which all need to be aligned toward the target domain for successful model development. Based on our research carried out over the last several years, object detection algorithms trained on synthetic data will always overfit and produce overconfident and misleading results if only 3D-rendered synthetic images are used in the test dataset. This is logical because the test dataset is comprised of the same synthetic features and textures used in the training images. It is not an inherent problem of 3D-rendered synthetic data, rather of basic overfitting. To overcome this problem, VFRAME has pioneered a hybrid approach that uses 3D-printed data to generate synthetic images in the “real world.” This enables the neural network to learn important features from both worlds during training.

Figures 8 and 9. Real and replica 9N235/9N210 submunitions. Figures courtesy of Adam Harvey.
3D-printed synthetic data (or just 3D-printed data) refers to the process of creating a 1:1 physical replica of an object using 3D-scanning, 3D-printing, and artistic replication. By recreating the digital surrogate object in the real world, this process escapes the limitations of 3D-rendered worlds and bridges the gap toward a “more real” reality. In other words, the 3D-printed replica can now be placed in a controlled staging environment to create scenes that would otherwise be too complex or costly to 3D model.
Figure 10. Sixty-four images from the 9N235 benchmark dataset created using the 3D printed replica.Courtesy of Adam Harvey.
Another significant advantage of using 3D-printed data for submunitions is safety. Obtaining submunitions always involves risk, and removing the explosives material to make it FFE involves further risk for EOD personnel. The 3D-printed replicas are inert, hollow, plastic, and can be made using environmentally responsible bioplastics like polylactic acid (PLA).
The results can be convincingly real. Figures 8 and 9 are photos of 9N235/9N210 submunitions. One is real and one is a replica. Both are covered in mud and photographed with the same camera in wet forest terrain.
Step 4: Benchmark Data
With the submunition 3D-modeled, synthetic images 3D-rendered, and 3D-printed models photographed, the next step is to curate the object detection benchmark dataset to evaluate how well the neural network can detect the object. Benchmark data is essential for understanding the accuracy of the trained object detector. An easy benchmark dataset yields unrealistic expectations for what the detector is capable of. To overcome bias in benchmark data, it is helpful to make use of data generated across many seasons, terrain, contributors, and hardware. Images should contain easy, medium, and difficult scenarios. Not only is diversity useful for the model metrics, but it helps communicate to end users how well the detector can be expected to perform when, for example, a munition is partially exploded, broken or partially buried, or when it will trigger false positives on similar looking objects. This is especially important for objects that pose safety and security risks for field operators.
The results also help guide the thresholds settings for “greedy” or “conservative deployments,” where false positive rates are balanced with higher true positive (recall) rates. Because the output is always a probabilistic determination, the actual deployment thresholds must be customized to the target environment. For example, a million-scale OSINT video analysis project could first triage everything above 90 percent accuracy, then look deeper at lower confidence (79 percent) matches when time permits. The more permissive threshold will usually locate more objects, but at the expense of more false positives. In another example, an aerial survey of an attack site could start with a low-confidence threshold because the environment is more constrained and any object slightly resembling the target munition could be analyzed further by zooming in.
| Source | Instances |
|---|---|
|
Photos and video frames with mixed replica and FFE |
722 |
|
Photos and video frames with only replica |
606 |
|
Photos and video frames of real FFE |
727 |
|
Photos from social media |
44 |
|
Total 9N235/9N210 benchmark annotations |
2,099 |

Figure 11. An example image from the VFRAME 9N235/9N210 benchmark dataset showing a partially exploded 9N235 photographed while on a field mission to Ukraine in 2023.Courtesy of Adam Harvey.
Step 5: Model Evaluation Metrics
The model is trained using synthetic data but evaluated using multiple types of real data, including images sourced online. The most common metrics are applied to measure how well it can detect the true positives (recall), how well it ignores the false positives (accuracy), and how precise the bounding boxes are. The two most important metrics for OSINT—precision and recall—are combined into one score called the F1 metric to broadly summarize expected model performance on other datasets.
For this 9N235/210 model, the F1 score is 0.98 at 0.641 confidence. This means that when setting the confidence threshold in the processing software, one should expect high-accuracy results, with only a few images missed. To detect more true positive objects, thereby increasing the recall, the confidence could be dropped toward 0.0, but this would trigger more false positives and decrease accuracy toward 0.2, which could be acceptable in certain scenarios.
An important caveat here is that these numbers are entirely dependent on the quality of a test dataset that is not transparently disclosed. This points to a larger issue with evaluating AI tools for mine and EO object detection: without officially recognized and accessible benchmark data, developers can too easily claim high success rates, overhyping technology and potentially eroding trust if the results do not deliver as advertised.
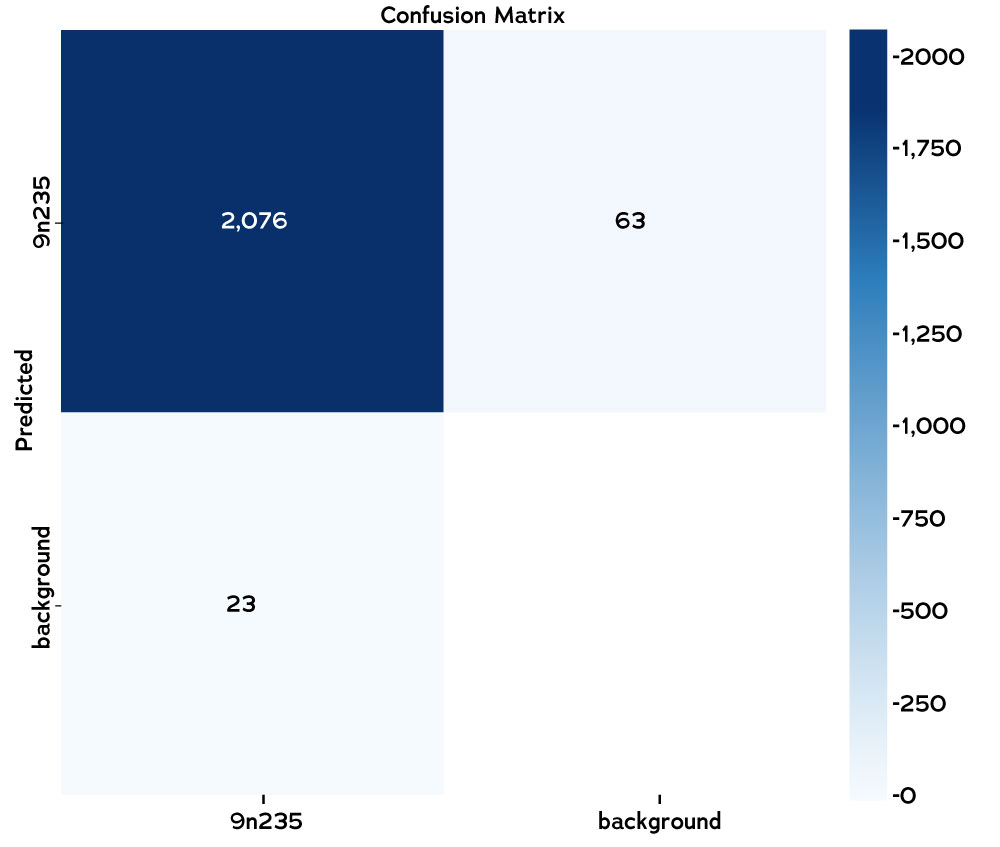
Figure 12. Confusion matrix for the 9N235/210 detector trained with the YOLOV5 framework. Courtesy of Adam Harvey.
To promote transparency and benchmark dataset integrity, the VFRAME project and Tech 4 Tracing are working toward the establishment of a voluntary and collaborative multi-party oversight committee to ensure AI models can be fairly evaluated through certified benchmark datasets. Until then, computer vision model metrics should not be entirely dismissed but rather be understood as a limited window of visibility into future real-world performance.
This limited window is still an important and widely used starting point to understand models. And the VFRAME 9N235 test dataset does include many diverse samples of objects in real situations from current conflicts sourced both online, from mine clearance operators, and from our own field missions. Sharing benchmark data from each source has a different set of issues: synthetic data could fuel misinformation and lower trust in OSINT documentation; data collected in the field could reveal sensitive geographic information; and data from mine-clearance operators in an active combat zone raises other security issues.
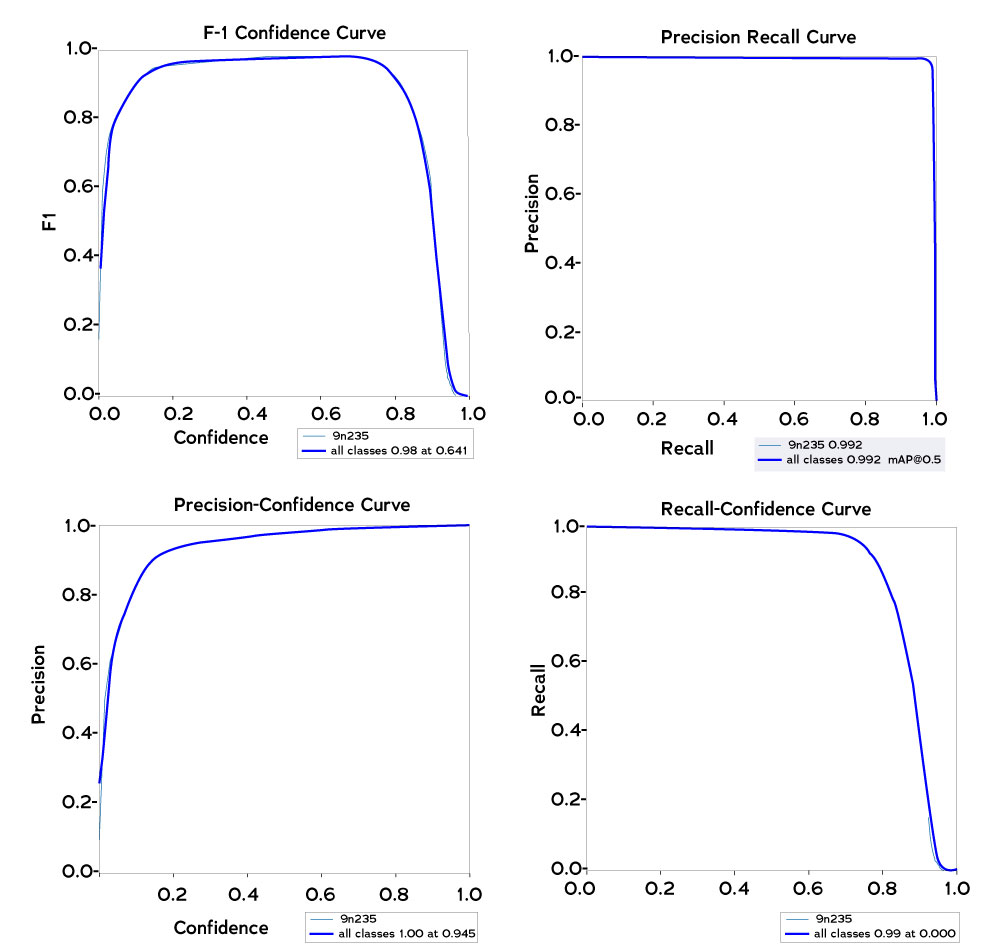
Figure 13. Model metrics for the 9N235/210 detector trained with the YOLOV5 framework. Courtesy of Adam Harvey.
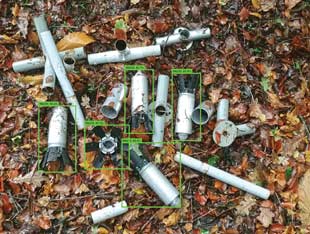
Figure 14. Test on low quality camera with motion blur using real FFE and 9N235/9N210 surrogate (replica) fabricated by Fenix Insight. Figure courtesy of Adam Harvey.
With these caveats in mind, the test dataset model metrics can still provide helpful insights. The confusion matrix shows the number of true positive detections (2076) compared to the false negative (23) and false positive (63). For objects like the 9N235/9N210 that can be significantly damaged and appear in multiple parts, there will always be small amount of variance in the metrics resulting from the intentional non-detection of shrapnel to avoid false positives. For example, the 9N235/210 tube without the nosecone or fins simply becomes a metal tube. This would be impractical to detect for OSINT tasks but would likely be useful for mine clearance. Detecting or avoiding metal tube detections is a result of tuning the threshold and the training dataset for the target domain.
Step 6: Test Images
In Figure 14, an example scene was constructed to check how well the detection algorithm differentiates from similar looking objects. The objects in the scene were made of the same material (false positives) yet were all successfully ignored while the submunition replicas (true positives) were correctly detected. These types of test images are useful not only during technical evaluation but also for visually communicating how well the detector can be expected to perform in similar scenes where similar looking objects are likely to appear.
 |
 |
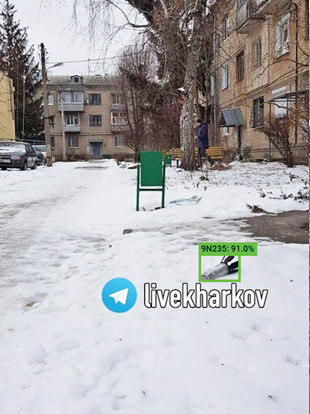
| Figure 15. Detection results on social media reference imagery. Courtesy of https://bit.ly/3Mtw9Pl. | Figure 16. Detection result on social media reference imagery. Courtesy of https://bit.ly/3ZKxxQI. |
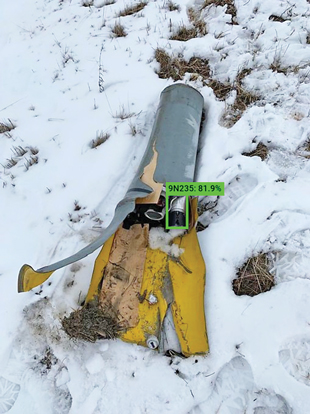
Finally, Figures 15, 16, and 17 illustrate expected performance in the OSINT domain, using images from the social media test set partition. Consider that these images were taken using different cameras then compressed during publication to social media platforms. Because the detection algorithm was trained specially to handle watermarks, lens distortion, and compression artifacts, the results are still accurate even when the submunition is partially occluded and still lodged inside the carrier rocket.Compared to previous conflicts analyzed with the VFRAME software, the images and videos from Ukraine are measurably higher quality and higher resolution. Understanding how resolution shifts in different regions, and will continue to increase in the future, aligns well with the synthetic training workflow which can be customized to generate compressed lower-resolution imagery to match older conflict zone media or used to generate sharper higher-resolution training data for current and future conflict zone analysis.
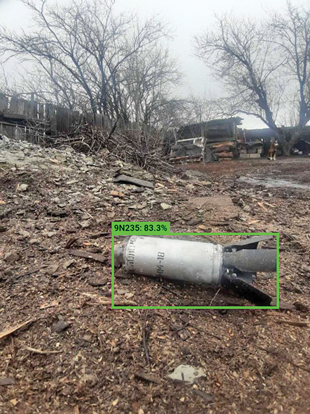
Figure 17. Detection result on social media reference imagery. Courtesy of https://bit.ly/417PUQH.
Compared to previous conflicts analyzed with the VFRAME software, the images and videos from Ukraine are measurably higher quality and higher resolution. Understanding how resolution shifts in different regions, and will continue to increase in the future, aligns well with the synthetic training workflow which can be customized to generate compressed lower-resolution imagery to match older conflict zone media or used to generate sharper higher-resolution training data for current and future conflict zone analysis.
Performance
The YOLOV5 model is trained from scratch in multiple architectures with an aggressive custom augmentation process and then exported for deployment on workstations or mobile/edge devices. Running on a HEDT (high-end desktop workstation), it achieves a maximum 187 FS with the nano architecture and the full performance (recommended) model reaches forty-three FPS (see Figure 18).
Conclusion
The multi-step process described here has shown success in detecting an EO object with distinctive features in photographic and video images exhibiting a wide range of lighting and weather conditions and object orientations. Its high performance makes it suited for detecting the 9N235/9N210 in OSINT applications given typical source image artifacts including watermarks, compression, and light motion blur, and various image ratios. With support from the European Commission,12 the next phase of this initiative will focus on optimizing a version designed for aerial deployment in drones, building a library of other priority EO object detector models, and the design of a mobile application for real-time field documentation and data collection. Eventual systematic deployment should also meet accountability principles for security uses of artificial intelligence and best practices for image authentication and digital evidence standards to ensure that detection data is admissible in legal accountability mechanisms.13
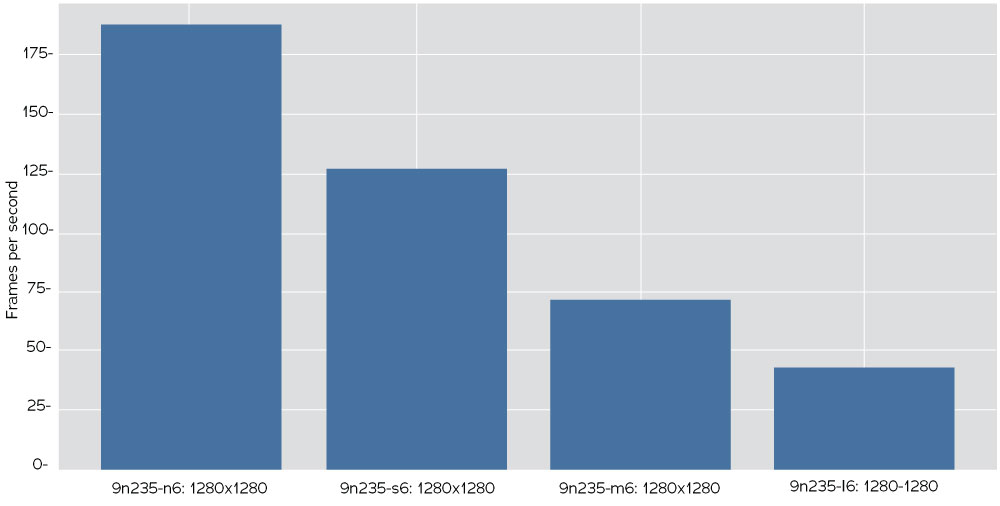
Figure 18. Frames per second on NVIDIA 3090 at 1280 pixels inference size averaged over one hundred iterations for nano, small, medium, and large YOLOV5 architectures at batch size eight using .pt model format. Figure courtesy of Adam Harvey.
This project is an example of new technology-based innovations that will continue to improve mine action and humanitarian and human rights investigators’ ability to detect a range of conventional arms and ammunition in a variety of contexts and thereby help save lives and hold perpetrators accountable for the misuse of prohibited weapons.
Acknowledgements
A number of organizations have supported this project during the last several years. Fenix Insight has provided support and coordination on benchmark data development. PrototypeFund provided initial research support synthetic data and SIDA/Meedan contributes operation support.
Adam Harvey
VFRAME.io
 Adam Harvey operates VFRAME, a computer vision project that develops open-source technology for human rights research, investigative journalists, and conflict zone monitoring. After several years of research and development into synthetic data fabrication techniques using 3D-rendering and 3D-printed data, this is the first publication of an object detection algorithm that uses all combined methods, as well as sufficient benchmark data to confirm the results.
Emile LeBrun
Director of Programs
Tech 4 Tracing
 Emile LeBrun is Director of Programs at Tech 4 Tracing (T4T), an international, non-profit partnership of arms control and new technology experts working to apply new technologies to arms and ammunition control. As a small arms control policy consultant researcher, he has managed projects for the Small Arms Survey and other research institutions since 2003.
| Stay updated | |||