
How UAV Lidar Imaging Can Locate and Map Minefield Features: Cuito Cuanavale, Angola
Katherine James [ The HALO Trust ], Gert Riemersma [ Routescene ], and Pedro Pacheco [ The HALO Trust ]
CISR Journal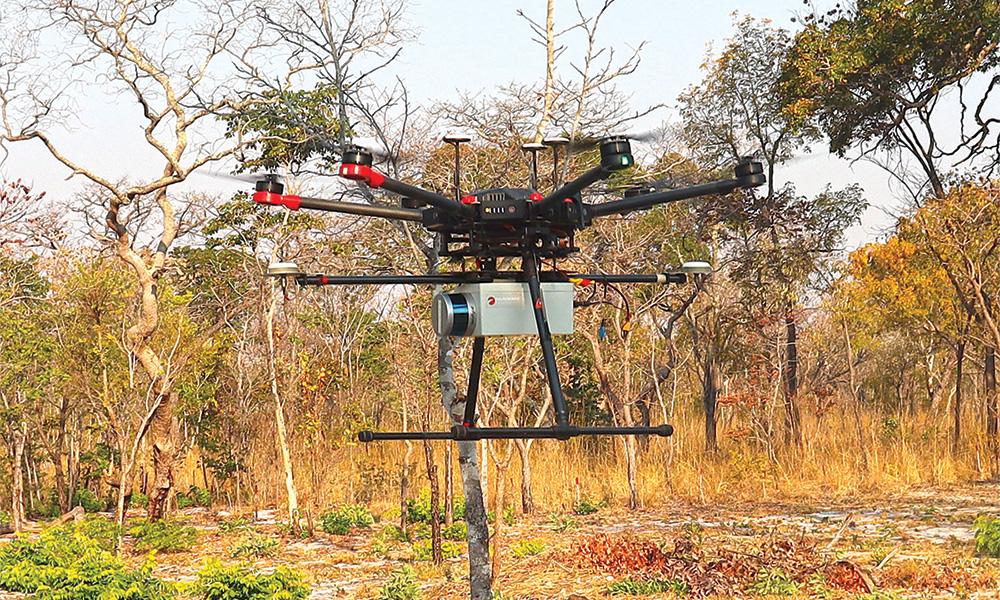
This article is brought to you by the Center for International Stabilization and Recovery (CISR) from issue 27.2 of The Journal of Conventional Weapons Destruction available on the JMU Scholarly Commons and Issuu.com
In this article we outline how an unmanned aerial vehicle (UAV) mounted light detection and ranging (Lidar) mapping system has been used for the detection and mapping of minefields in vegetated areas around Cuito Cuanavale, Angola. Work took place as part of The HALO Trust’s (HALO) research into aiding clearance of landmines and unexploded ordnance (UXO) using drones.
History of the Conflict and Contamination
The Angola Civil war was fought from 1975 until 2002,1 primarily between the People's Movement for the Liberation of Angola (MPLA) and the National Union for the Total Independence of Angola (UNITA), with, at times, external military support from Cuba and South Africa. The province of Cuando Cubango (Figure 1) saw some of the heaviest fighting, and the Battle of Cuito Cuanavale (September 1987–March 1988) was the largest engagement of the war.2 There was extensive mine laying throughout the conflict by both sides3—including mixed threat, anti-vehicle (AV), and anti-personnel (AP)—which resulted in mine belts that continue to pose a deadly threat to the local community. HALO began clearance operations in Cuito Cuanavale in 2005 and by the end of 2022, it had cleared 29,000 AP mines and 11,000 AV mines.
However, many minefields remain to be cleared. To support the identification of mines in recent years, HALO has trialed drone surveys using thermal infrared (TIR) and red, green, and blue (RGB) cameras. However, AV mines or indicators of conflict such as trenches, bunkers, or craters, are no longer visible from the ground or air using UAV-mounted RGB or TIR sensors due to overgrown vegetation. Therefore, other methods of detection are needed to aid in surveys of these areas.
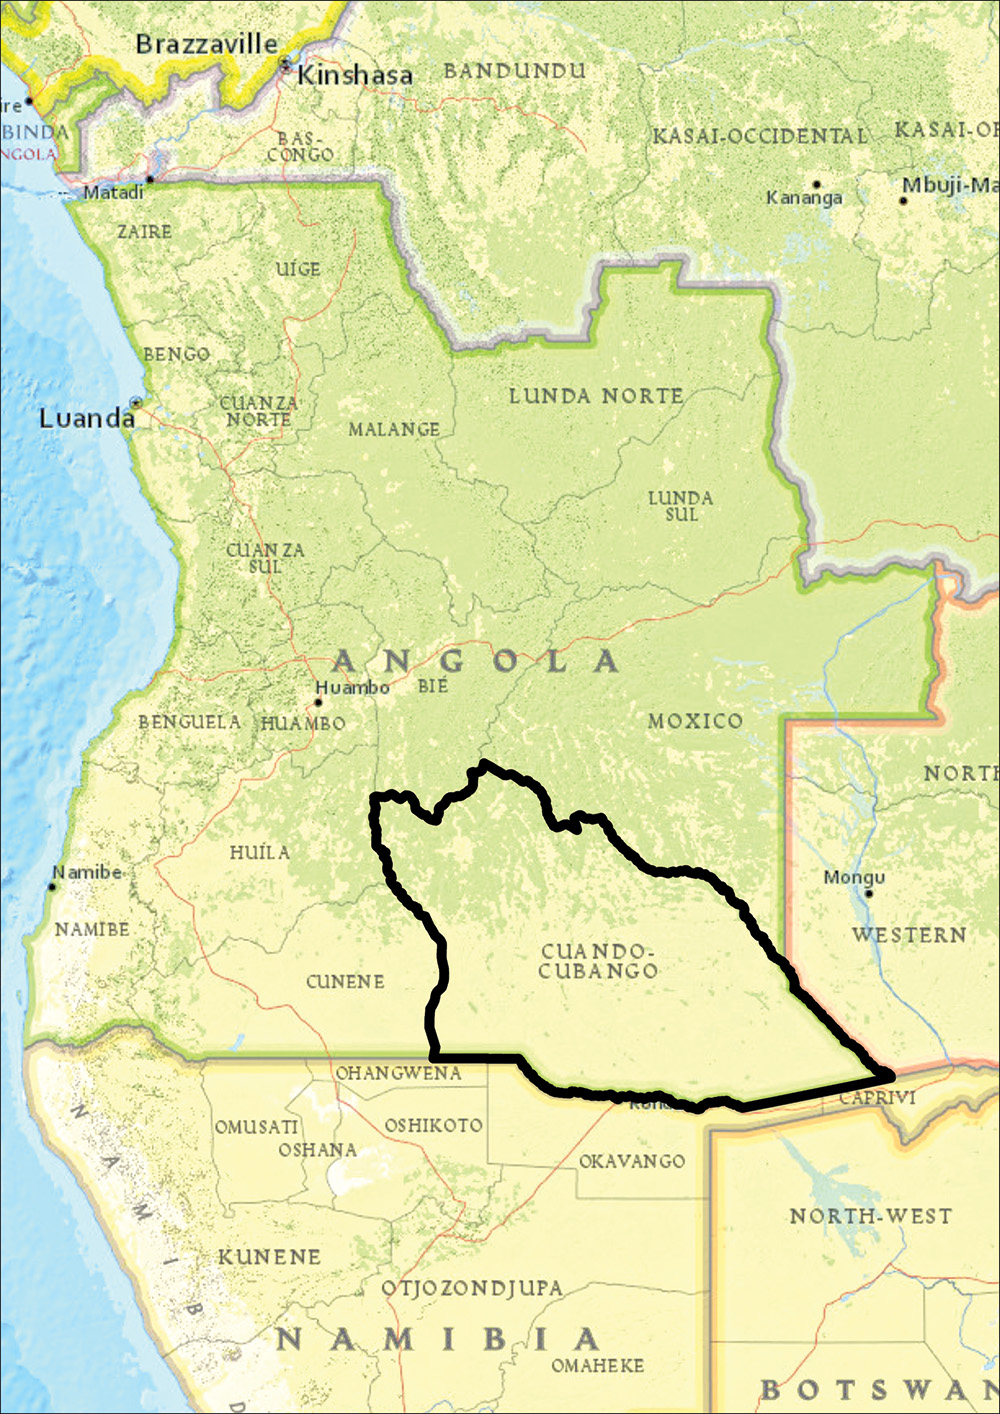
Figure 1. Map of Angola with Cuando Cubango Province highlighted. Sources: National Geographic, Esri, DeLorme, HERE, UNEP-WCMC, USGS, NASA, ESA, METI, NRCAN, GEBCO, NOAA, iPC.
UAVs in Mine Action
Most of the UAV work within the mine action sector focuses on the use of small UAVs equipped with RGB cameras to map known hazardous areas. The results are used to identify surface-level contamination or ground signs of shallow buried contamination, such as AV mines.4 Therefore, utilizing sensors that go beyond the visible region of the electro-magnetic spectrum can help identify and determine the extent of minefield features and contamination in a region. Current research is looking into how TIR sensors can be used in the detection of shallow-buried AV mines and other large UXO.5 However, this contamination is often covered with vegetation or the mines are buried too deeply to be detected with TIR or RGB sensors. In these circumstances, Lidar technology can be utilized to identify evidence of craters from detonations or to map trenches that are often associated with the mine lines.
Scope
To the authors’ knowledge, this is the first time that Lidar technology has been used in the identification of minefield features in Angola to aid in clearance efforts. The ability to map full or partial trenches will allow teams to predict where a mine line may be located relative to a trench, as well as where it may change direction or end. This information can be used to inform clearance planning for future operations, making clearance efforts safer and where possible, speed up clearance through a targeted approach. In areas where there are large gaps in the mine lines or a sharp change in direction, utilizing Lidar technology to identify locations of craters from AV mine detonations, often caused by animal accidents and wildfires, can aid in finding the location of a mine line. This helps streamline clearance efforts by directing teams toward specific evidence points.
The scope of this research included
- Determining if the chosen UAV Lidar system is suitable for the detection of minefield features.
- Determining which minefield features are detectable using UAV Lidar.
Hypothesis
Vegetation prevents the observation of trenches, bunkers, and craters using conventional remote sensing techniques such as RGB drone imagery and satellite imagery. It is hypothesized that due to Lidar’s ability to penetrate vegetation, this will allow for the mapping of trenches, bunkers, and craters.
Task Locations
Three tasks were identified in the Cuito Cuanavale area based on heavy fighting and the presence of known or suspected minefield features (Figure 3).
The terrain across the three tasks is relatively flat, showing minimal changes in elevation. However, the vegetation varies: Tasks A and C both have dense tree coverage, while Task B has light tree and shrub coverage. The expected features to be detected were main trenches, communication trenches, foxholes (one-man defensive positions), shell scrapes (shallow excavations allowing soldiers to shield from shell bursts and small arms fire),6 and craters from detonations.
- Task A: An abandoned military base outside of Longa village, approximately 100km northwest of Cuito Cuanavale.
- Task B: An extensive defensive mine line with an associated trench, approximately nine km east of Cuito Cuanavale.
- Task C: An abandoned military base, approximately twenty-five km southeast of Cuito Cuanavale, with evidence of AP mine laying within the base and at least one known trench and a suspected second trench.
Equipment and Software
A commercially available Routescene UAV Lidar system, mounted on a DJI M600 Pro UAV, was used for data collection (Figure 2). The DJI M600 Pro is a hexacopter lifting a five kg payload for approximately five minutes, and automated flights were executed using the DJI Pilot Application.
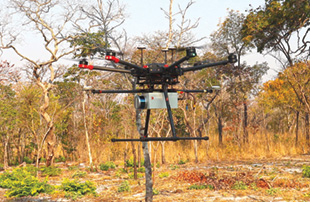
Figure 2. A Routescene LidarPod mounted on a DJI M600 Pro in Angola. Courtesy of Claire Lovelance (The HALO Trust, Angola).
Routescene constructed a demonstration unit for this research project. The unit contained a sixteen-channel Lidar sensor capable of collecting approximately 600,000 points per second, a global navigation satellite system/inertial navigation system (GNSS/INS) sensor, and data storage to capture twelve hours of data. The system effectively penetrates dense vegetation to reach the surface beneath to detect ground disturbances that would not otherwise be visible. The unit is designed to be resistant to vibrations in flight and handling by users. The system does not require mobile or internet connection to operate, providing operational autonomy and data security. GNSS data was collected using a Trimble R2 for the post-processing of the trajectory to ensure the data was as accurate as possible.
The raw Lidar datasets were processed using Routescene’s LidarViewer Pro software, specifically developed to georeference, clean, reduce, and visualize Lidar data. The software was used to export a digital terrain model (DTM) of the tasks for analysis in ESRI ArcGIS Pro.
Data Collection
Data at Tasks A and B was collected from forty meters above ground level (AGL) with one day of collection for each site. Data from Task C was collected at fifty meters AGL over three days. Due to the size of the area and time limitations, the flight height had to be increased to ensure the full area could be surveyed. Tasks A and B were surveyed during the dry season (August 2021) when vegetation cover was at its lowest. Task C was surveyed during the rainy season (April 2022) when vegetation cover was at its highest. The difference in vegetation density may have impacted the results and what could be identified in the data.
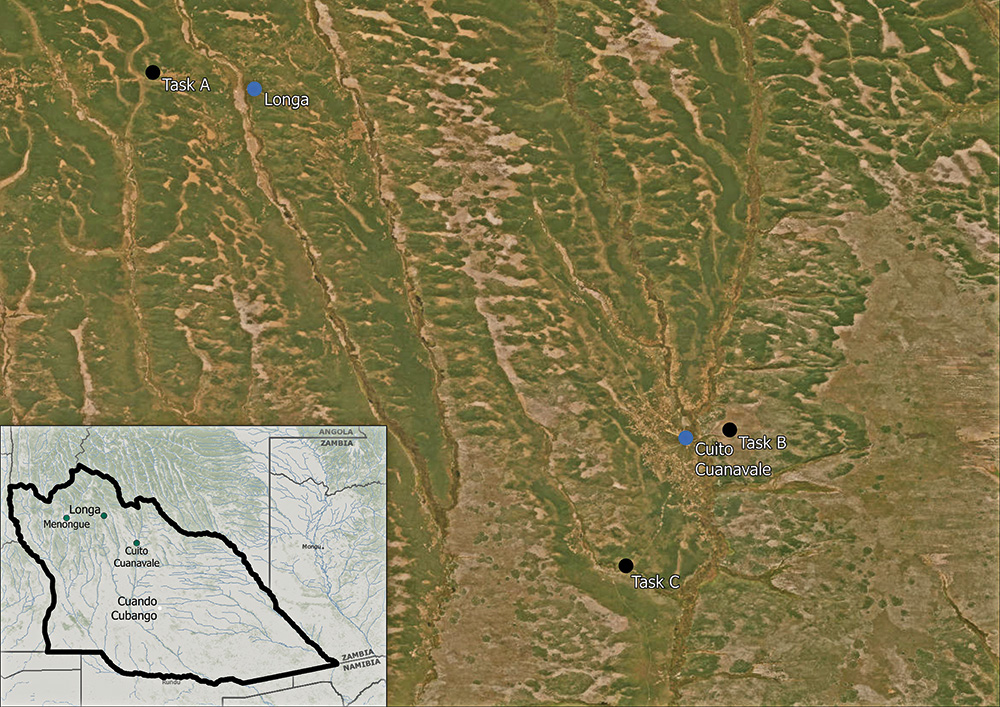
Figure 3. The location of the tasks surveyed in comparison to Cuito Cuanavale and Longa. Inset base map courtesy of Esri, GEBCO, NOAA, National Geographic, DeLorme, HERE, Geonames, and other contributors. Sources: Esri, DigitalGlobe, GeoEye, i-cubed.
Results
The analysis of DTMs created from the Lidar data show positive results for the use of UAV Lidar systems for minefield feature detection across the three locations.
Task A
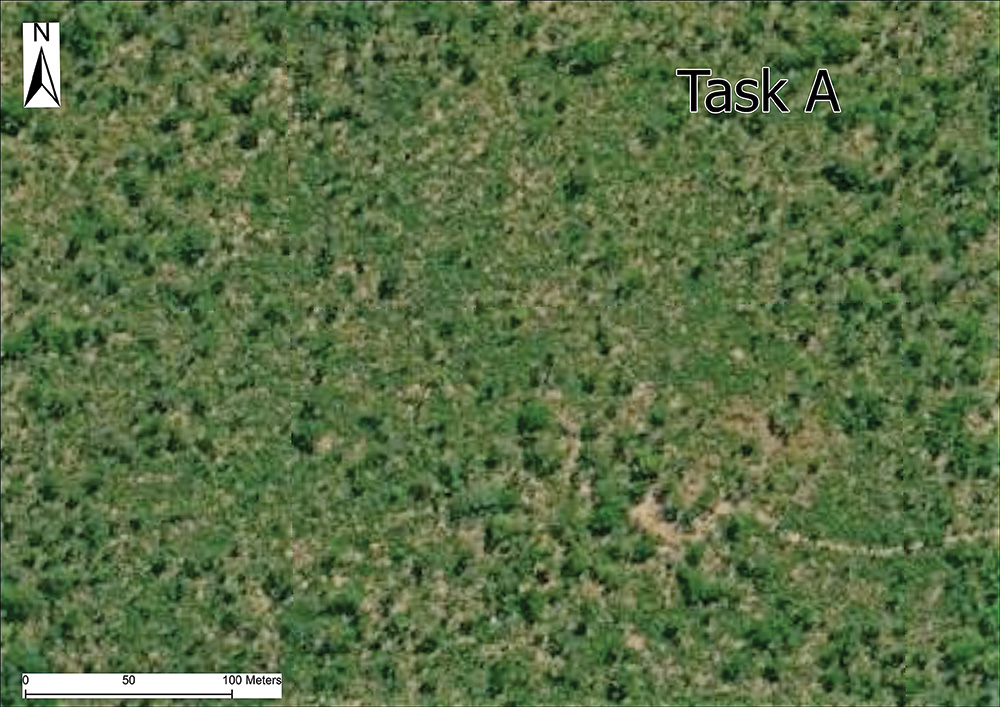
Satellite imagery from Task A shows little evidence of the historical military base. While an access path is visible in the southeast of the site, it is not possible to identify other features (Figure 4). Due to a lack of safe access, only a partial survey of the task was possible.
When the Lidar data is overlaid onto satellite imagery, multiple minefield features become apparent (Figure 6). These include a main trench, communication trench, foxholes,7 and suspected shell scrapes.
The predominant feature is the defensive main trench around the former military base, with a communications trench branching off the northwestern internal side of the trench (Figure 7). In total, 496 meters of main trench and forty meters of communication trenches were identified. A further twenty-four feature points were identified, primarily concentrated in the southern area of the data. Firstly, ten foxholes follow the inside of the main trench line, dug as part of the defensive positions around the base. Secondly, there is evidence of nine crater-like features clustered inside the southern areas of the base, with two further north, closer to the communication trench. It is unclear what caused these features, though it is suspected that these are shell scrapes. Thirdly, there is a line of six crater-like features outside the southern area of the main trench. Similarly, it is unclear what caused these. It is unlikely to be AV mines as none were found in this location. As with those inside the base, these may be evidence of shell scrapes (Figure 7).
At this task site the average depth and width of the foxholes (0.58m and 2.36m respectively) and the suspected shell scrapes (0.77m and 2.38m respectively) were similar, suggesting that these are the same feature. However, due to the suspected shell scrapes not being in the typical location and pattern of foxholes, these were identified as a separate feature. Thick vegetation cover at the task site prevented accurate identification of all features in the Lidar data (Figure 5).
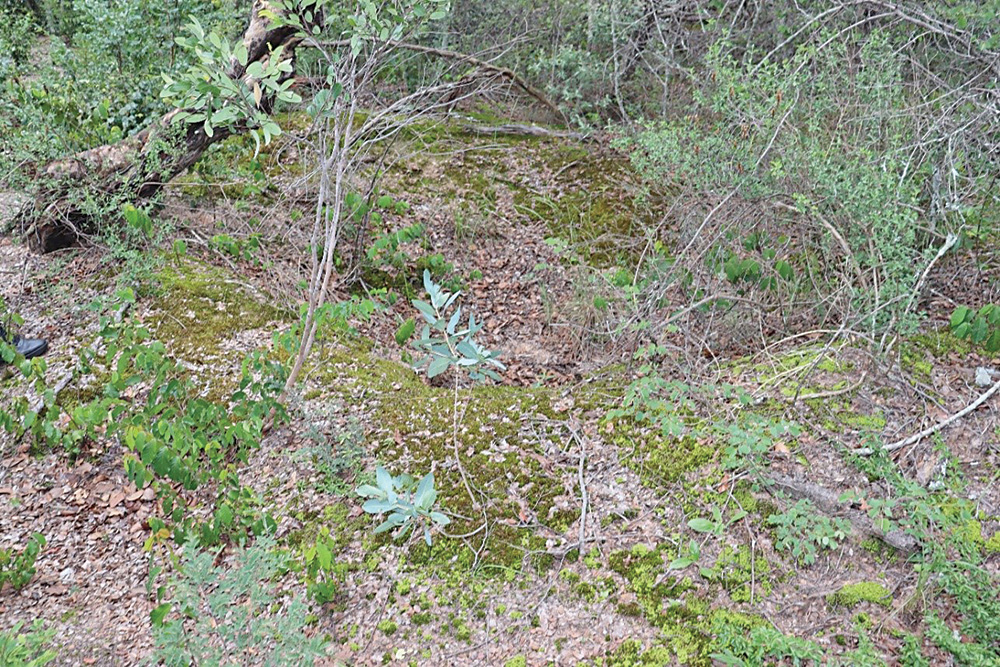
Figure 5. Example of the trench area covered by vegetation at Task A. Courtesy of Pedro Pacheco.
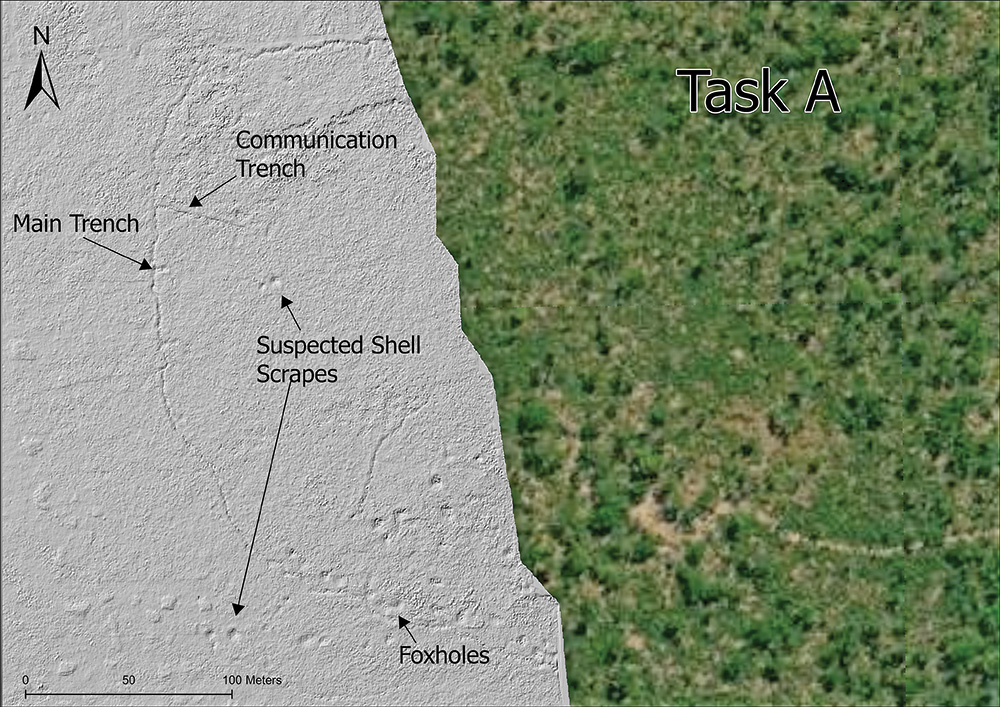
Figure 6. Lidar data overlaid on the task, showing features such as trenches and craters. Basemap sources: Esri, DigitalGlobe, GeoEye, i-cubed, USDA FSA, USGS, AEX, Getmapping, Aerogrid, IGN, IGP, swisstopo, and the GIS user community.
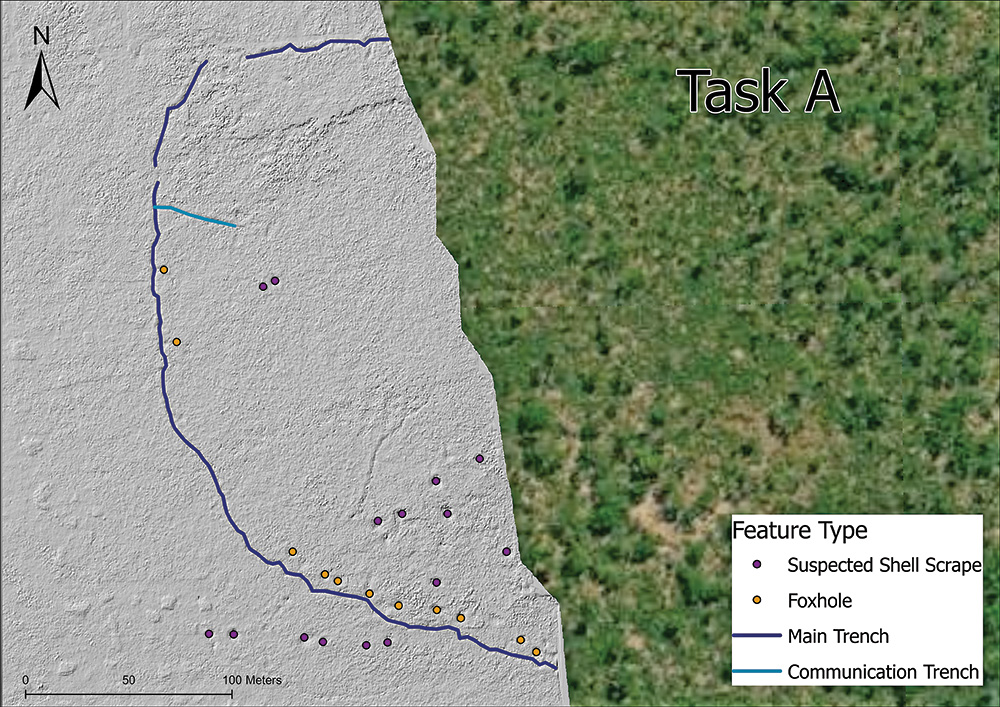
Figure 7. The predominant feature types of Task B mapped with unique symbols.Sources: Esri, DigitalGlobe, GeoEye, i-cubed, USDA FSA, USGS, AEX, Getmapping, Aerogrid, IGN, IGP, swisstopo, and the GIS user community.
Task B
Due to lighter vegetation at Task B, there is slight evidence of the main trench remains in satellite imagery (Figure 9). However, other features are not visible.
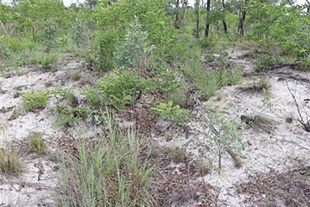
Figure 8. Example of the historic trench line at Task B with vegetation overgrowth reducing visibility. Courtesy of Pedro Pacheco.
Due to thick vegetation (Figure 8) and lack of safe access to the task site, it was difficult to see what remained of the trench system during field visits.
The analysis of the Lidar data identified multiple features that could not be seen in the satellite imagery, including a larger extent of the main trench, communication trenches, foxholes, and suspected craters (Figure 10).
In total, 500m of main trench, 281m of communication trenches, thirty-four foxholes, and two suspected craters were identified (Figure 11). The two suspected craters are unlikely to be foxholes due to their distance from the main trench. These may be craters from exploded ordnance (EO), however it is unlikely to be from AV mines as the mine line is to the east of the trench. These features were in an uncleared area, so it was not possible to confirm the exact nature of the features. The suspected craters averaged 5.85m in width and 0.65m in depth. The foxholes on this task averaged 0.67m in depth and 2.54m in width. While the majority of the tracks are visible in satellite imagery, the Lidar data reveals additional historical tracks. This information can be used to identify locations of possible safe access roads to a task site.
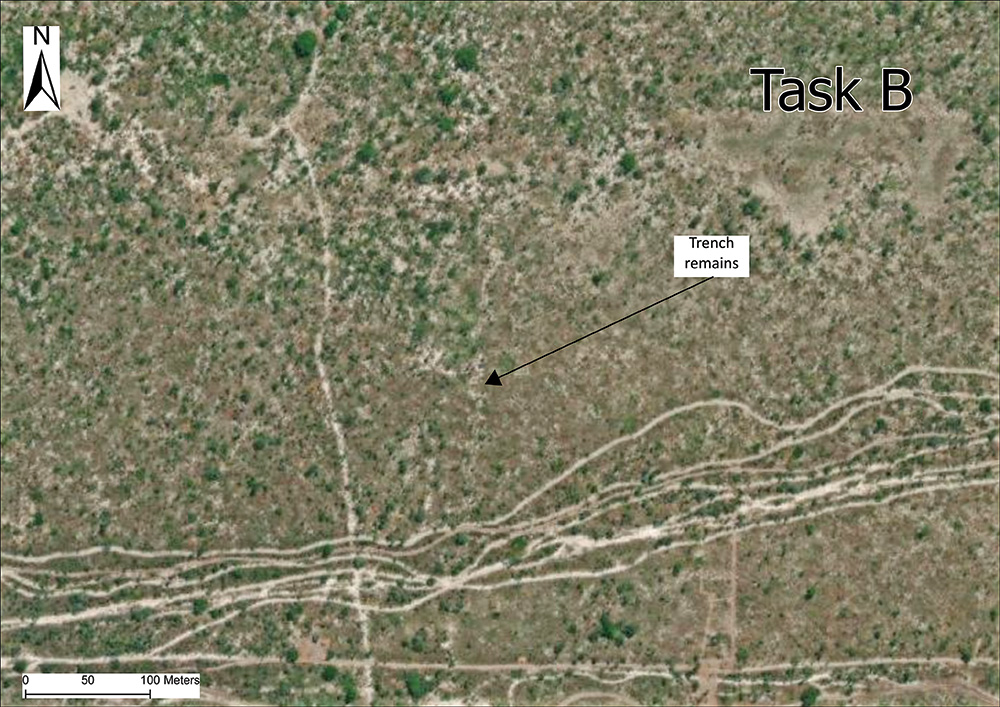
Figure 9. Satellite data of task B showing faint evidence of the trench line. Sources: Esri, DigitalGlobe, GeoEye, i-cubed, USDA FSA, USGS, AEX, Getmaping, Aerogrid, IGN, IGP, swisstopo, and the GIS user community.
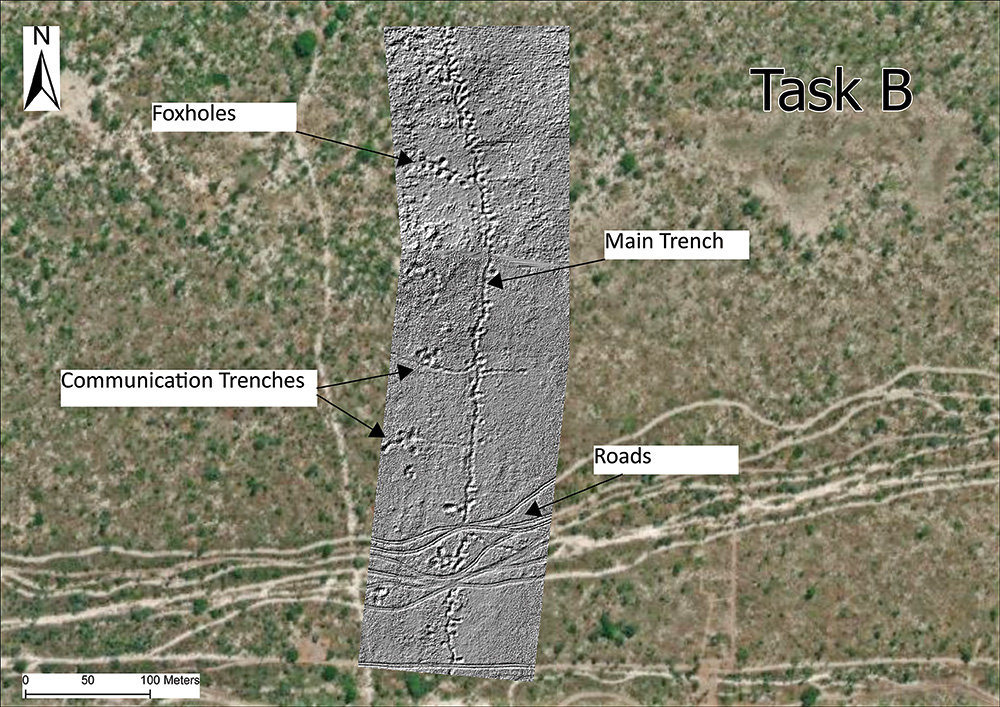
Figure 10. Lidar data from Task B showing one main trench, four communication trenches, and multiple suspected foxhole locations. Sources: Esri, DigitalGlobe, GeoEye, i-cubed, USDA FSA, USGS, AEX, Getmapping, Aerogrid, IGN, IGP, swisstopo, and the GIS user community.
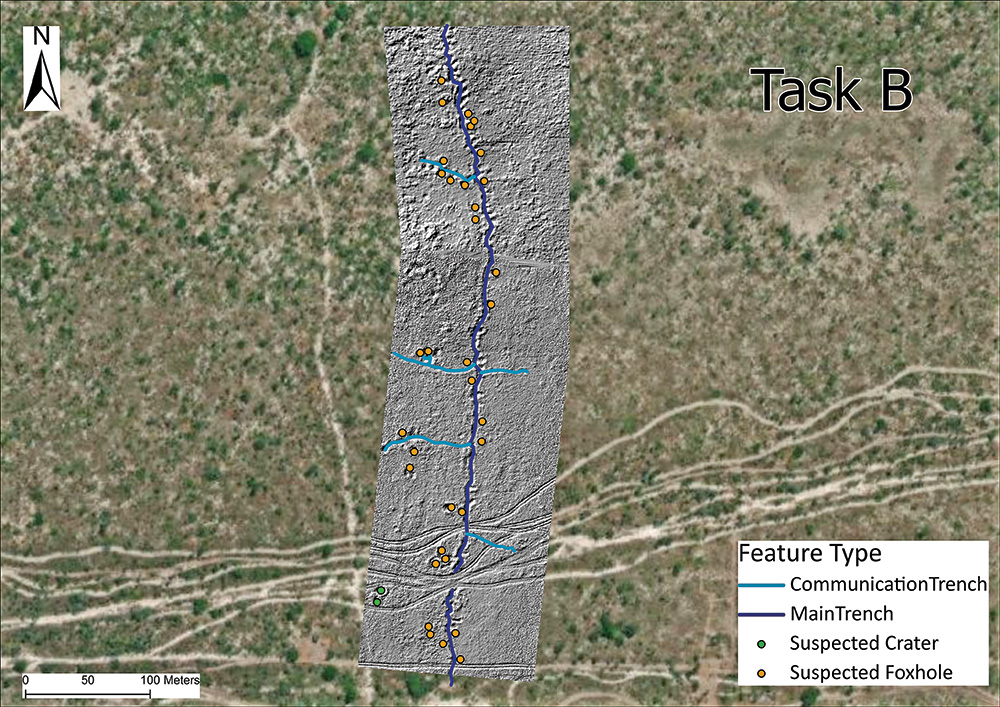
Figure 11. The predominant feature types at Task B mapped with unique symbols. Sources: Esri, DigitalGlobe, GeoEye, i-cubed, USDA FSA, USGS, AEX, Getmapping, Aerogrid, IGN, IGP, swisstopo, and the GIS user community.
Task C
From satellite imagery (Figure 12) and from the ground, it is not possible to identify the locations of the suspected minefield features due to the dense vegetation (Figure 13).
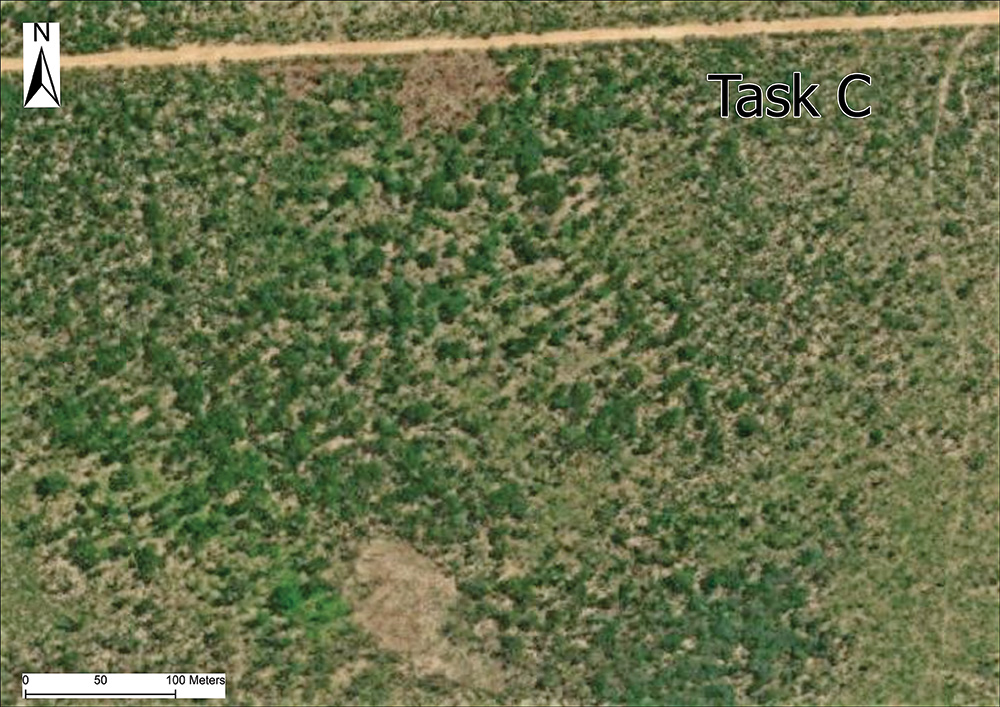
Figure 12. Satellite data over Task C, showing no evidence of the previous military base. Sources: Esri, DigitalGlobe, GeoEye, i-cubed, USDA FSA, USGS, AEX, Getmapping, Aerogrid, IGN, IGP, swisstopo, and the GIS User Community.
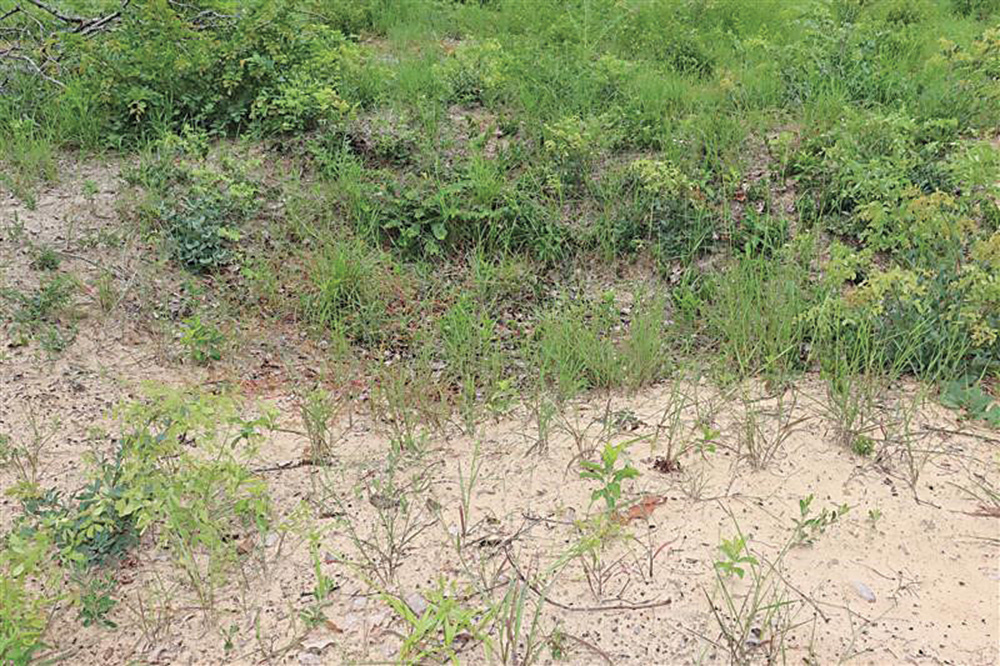
Figure 13. Example of a foxhole from Task C. Courtesy of Pedro Pacheco.
Task C was suspected to have at least a single trench and multiple foxholes surrounding the previous military base. However, the Lidar data shows evidence of two trench systems surrounding the former base, as well as communication trenches (Figure 14). The data also shows 157 crater-like features, which follow both trench lines. These are believed to be foxholes due to their regular spacing near the trench lines.
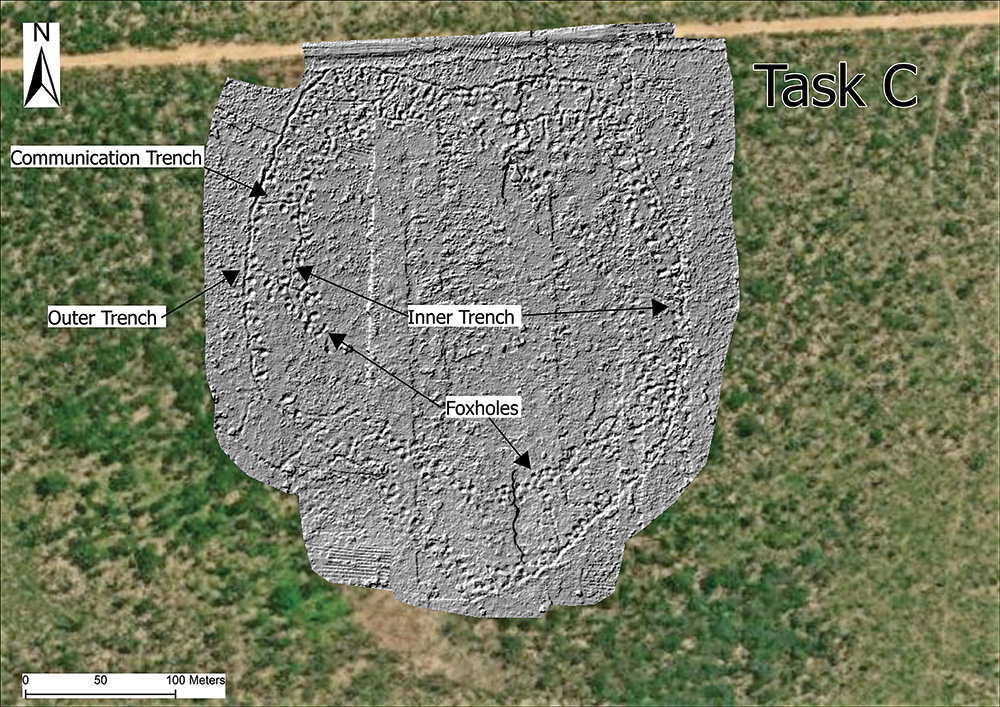
Figure 14. Lidar data over Task C, showing the trenches and foxholes that are not visible through the vegetation. Sources: Esri, DigitalGlobe, GeoEye, i-cubed, USDA FSA, USGS, AEX, Getmapping, Aerogrid, IGN, IGP, swisstopo, and the GIS user community.
Gaps in the trench systems observed in the data could result from various factors, such as soil infill over time, ground leveling within the trench, or rainwater in the trench obstructing Lidar penetration to the bottom. Although the trench data is incomplete, there is a continuation of the foxholes in the southern region between the two extents of the inner trench. This suggests that the trench once continued to create a circular inner trench system. Overall, 1,429m of main trench (828m on the outer trench and 601m of inner trench), seventy-three meters of communication trench, and 157 foxholes were identified on this task (Figure 15). The foxholes averaged 0.80m in depth and 2.81m in width.
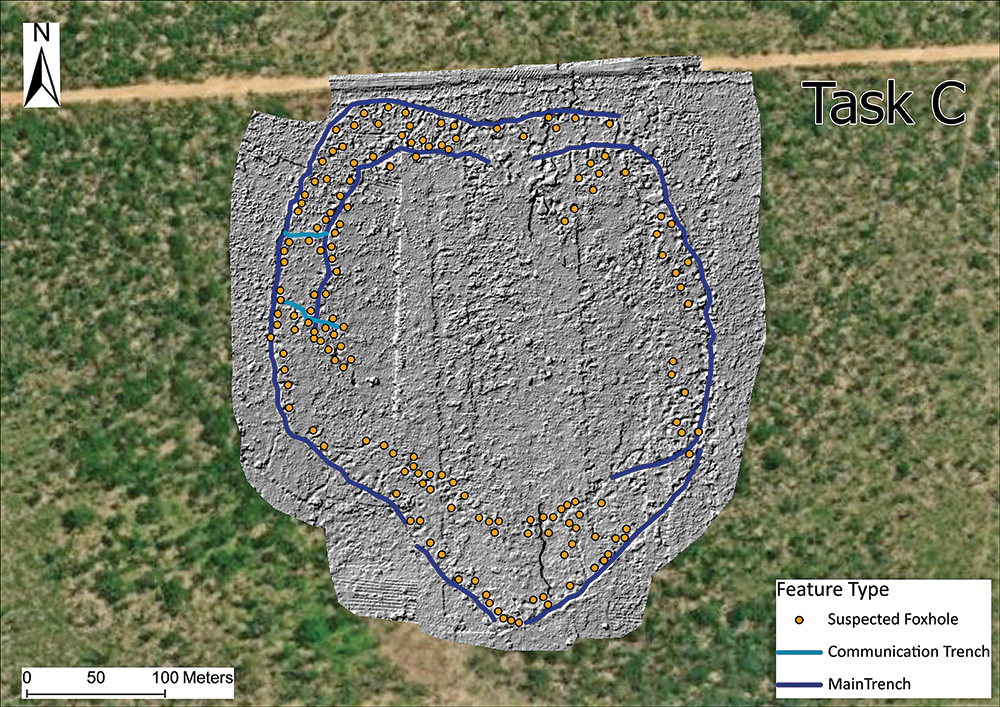
Figure 15. The trenches are suspected foxholes detected in Lidar mapped with unique symbols. Sources: Esri, DigitalGlobe, GeoEye, i-cubed, USDA FSA, USGS, AEX, Getmapping, Aerogrid, IGN, IGP, swisstopo, and the GIS user community.
Discussion
This research has shown that off-the-shelf drones mounted with UAV Lidar systems and the associated outputs have significant value in Angola for the identification of minefield feature detection. The results provided solid information that aided HALO in targeting clearance operations on these minefields. To distinguish between foxholes and craters in Lidar data, two methods can be employed to gather ground truth information for accurate feature identification. First, if in safe-to-access areas, onsite measurements can be taken. Second, in unsafe or low-vegetation areas, a drone with an RGB camera can gather data for high-resolution orthophotos to confirm feature identification. This information can contribute to a minefield feature database, including dimensions, location, and age, to enhance future analysis and facilitate work with increased confidence and speed.
There were several operational limitations during this study. Firstly, many of the minefield tasks in Angola are twenty to thirty km long and the maximum distance that the M600 could fly was 1-1.5km. This was due to a short drone battery life combined with loss of visual line of sight of the drone due to vegetation. The lack of suitable drone take-off and landing points also restricted the size of area that could be surveyed in a day. Due to the remoteness of the survey area, there was limited access to power sources to recharge the drone batteries between flights, limiting the number of flights to two per day. If research were to continue using off-the-shelf drones, users should consider utilizing a generator in the field to charge the batteries and to allow for increased UAV Lidar surveys. Future research should consider the use of longer endurance drones and beyond visual line of sight (BVLOS) operations. Hybrid drones rely on fuel rather than batteries and can fly for longer periods of time, enabling larger surveys.
Additionally, environmental conditions may have impacted the data collection. Task C was surveyed during the rainy season, which meant the vegetation was at its densest and there may have been water infilling some of the features. While this study demonstrates that UAV Lidar can successfully penetrate through vegetation of differing densities, the best outputs were gathered during the dry season when the vegetation coverage was lighter. Optimal data collection times and the deployment of a thirty-two-channel UAV Lidar system should be considered when planning surveys in the future. The increased number of channels provides increased vegetation penetration capability, resulting in higher resolution outputs. It also enables flights to be undertaken at higher altitudes without compromising performance.
Further research should also be carried out using Routescene's UAV Lidar systems in other post-conflict countries. The systems have a wide operating temperature range (-20 to +65°C / -4 to +149°F) and can withstand light rain. The systems are used by forestry, environmental, and research organizations operating in diverse conditions across the world from the Arctic to Europe.
While Routescene's LidarViewer Pro software is used offline, the post-processing of the trajectory can only be undertaken online as it requires additional GNSS information, which is only available from specialist portals twenty-four hours after a survey is completed. This caused delays in data processing which should be factored into future planning.
Conclusions
This research has proven that UAV mounted Lidar systems can be used to detect minefield features which can be indicators of minelaying. The Lidar data provided evidence of trenches, craters, and foxholes across all tasks surveyed, which were either undetectable or only partially visible in satellite imagery. Remote sensing is not a replacement for but is complimentary to conventional minefield non-technical survey (NTS). This work demonstrates how valuable Lidar data can be to provide evidence that is not obtainable by other means, offering advantages over RGB and TIR imagery when looking for minefield features hidden by vegetation.
Within HALO’s mine clearance operations in Angola, the Lidar data outputs, combined with contextual knowledge on the ground, have provided valuable information to aid in NTS operations and to target technical survey and clearance operations.
Future Work
Data collected during Lidar surveys can be used to build a database of minefield features found in each country. This will allow for the classification of features to accelerate learning. This data could also be used in the training of machine learning algorithms, which would speed up the analysis of data and reduce the impact of human bias in data analysis. In the future, HALO plans to carry out further research into the utility of UAV mounted Lidar systems in countries with different environmental conditions and landscapes, such as Ukraine and Sri Lanka.
Acknowledgements
We would particularly like to thank an anonymous private donor for their extremely generous support for HALO’s UAV trials in Angola and their commitment to innovation in mine action. This project would not have been possible without their help. We would like to thank Routescene for providing the UAV LiDAR system, software, training, and ongoing support since 2020. This has included a demonstration project, technical, and data processing support. In addition, we would like to thank Claire Lovelace and Siân McGee from The HALO Trust Angola programme for their ongoing support in the field and for supporting with the analysis of data.
Katherine James
Remote Sensing Specialist
The HALO Trust
 Katherine James is a Remote Sensing Specialist working with The HALO Trust (HALO). She specializes in the use of UAVs for assisting in the removal of landmines and other unexploded ordnance in countries and territories that have been affected by conflict. Additionally, she is responsible for implementing the deployment of small drones for supporting non-technical survey for HALO globally. James holds a bachelor’s degree in geography from Aberystwyth University and a Master of Science in Earth Observation and Geoinformation Management from the University of Edinburgh.
Gert Riemersma
Chief Technical Officer
Routescene
 Gert Riemersma is the founder, president, and Chief Technical Officer at Routescene. A technical innovator with over thirty-five years international survey and business experience, he has been working with Lidar since 2008 and with UAV Lidar since 2013. He specializes in the development of survey and mapping systems and software, converting technically challenging problems into practical products. A qualified Land & Hydrographic Surveyor, Riemersma has many years of survey and hydrographic experience gained in a variety of different environments and locations around the world.
Pedro Pacheco
GIS Officer; Drone Pilot
The HALO Trust
 Pedro Pacheco is a GIS officer and drone pilot with The HALO Trust program in Angola. He focuses on the use of drone surveys for non-technical survey support to aid in clearance planning. Pacheco graduated from Agostinho University with a bachelor’s in geography, with a focus on Satellite Image Processing and Geospatial Information Technology.
| Follow us on social media: | |||