
Mapping Unexploded Ordnance in Syria: Harnessing the Power of Open-Source Information
By Hampton Stall,* Jennifer Hudson,** Evan Leendertse,* Hari Prasad,* Chris McNaboe,* Rana Shabb,* and Jonathan Robinson***
CISR Journal
This article is brought to you by the Center for International Stabilization and Recovery (CISR) from issue 26.1 & 2 of The Journal of Conventional Weapons Destruction available on the JMU Scholarly Commons and Issuu.com
*The Carter Center’s Conflict Resolution Program
**University of Central Florida
***Brown University’s Center for Human Rights and Humanitarian Studies
For over a decade, the widespread use of explosive weapons by all sides in the Syrian conflict has been well documented by a litany of public sources. Many of these explosive munitions fail to detonate as intended, thereby becoming unexploded ordnance (UXO) that threaten post-conflict recovery. To begin the process of clearing these explosive remnants of war (ERW), desk studies/non-technical studies can be utilized to initially assess the concentration and distribution of explosive weapons across a conflict zone, which in turn suggest the risk of UXO in an area. Traditional methods in non-technical surveys (NTS) focus on unweighted conflict intensity scores (counting the number of events) or after-the-fact munition detonations to determine current contamination.1 The authors propose a novel, nuanced approach to counting the number of munitions per event, not just the number of events. This new open-source weighted estimate (OSWE) method contains higher-fidelity data for analysis with more specific coverage across a larger geographic area than prior models. Using crucial and corroborated open-source investigation workflows, the authors created a nationwide assessment paradigm. In comparison with older models, we anticipate that the OSWE method of estimating UXO concentration is more useful across a greater range of geographic scopes through its leverage of big data, weighted nature, and data selection for events likely to generate UXO. The OSWE method also produces an estimate for UXO in Syria (a minimum of 100,000 nationwide). These are important findings, as more accurate estimates can be replicated across contexts, including in Ukraine.
Introduction
Although media attention has waned, the Syrian conflict continues, albeit on a smaller scale.2 A nationwide cease-fire announced in March 2020 has largely held, leading to minimal exchange of territory among the major warring factions. Despite relatively constant areas of control, the use of explosive weapons and the detonation of UXO is a weekly occurrence. These detonations happen across the country regardless of which faction controls territories and often at the cost of civilian life and limb.
In Syria, clearance of explosive contaminants is disrupted by a slew of variables, namely instabilities in project funding, a volatile security environment, a prohibitive sanctions regime, uncooperative local partners, and security access challenges of remote contamination assessment. Despite these complicating variables, this paper will specifically focus on the initial stages of the explosive ordnance (EO) clearance process by using open-source data on the conflict in Syria to enhance an NTS. This approach is intended to assist in the prioritization of key areas.
In 2011, many Syrian civilians took to the streets, calling for reform as part of a popular national protest inspired by other mass mobilizations collectively described as the Arab Uprisings. An ensuing security crackdown on peaceful protesters prompted the protest movement to call for the overthrow of the Syrian government led by President Bashar al-Assad.3 Further crackdowns led to defections from the armed forces of Syria, and armed demonstrators shooting back at military forces sent to quell riots. This cycle escalated into open conflict, occurring for over a decade with four major territory-holding factions vying for control. Two dozen more international armed forces have also engaged in Syria, mostly through airstrikes and artillery strikes.
Syria has had stable frontlines since the spring of 2020, when a cease-fire was brokered between the government of Syria and the Turkish-backed opposition in Syria’s northwest. While no new major offensive has occurred since then—itself a mark of the cease-fire’s conflict resolution success—the term “cease-fire” is a misnomer, as indirect conflict and occasional clashes are still reported daily in Syria. Syria’s northwest region, where frontlines between the opposition and the government meet, averages at least 350 conflict events per month as recorded by the Armed Conflict and Location Event Database (ACLED).
Literature Review
Since World War II, UXO have traditionally been detected on the ground by clearance teams who detect potential hazards, excavate, and determine if the object is a UXO.4 The prevailing approaches used in humanitarian mine action (HMA) employ either magnetometers or terrestrial electromagnetic induction (EMI) systems.5 Although these have been validated as one of the most dependable geophysical methods for HMA, they have several weaknesses, including high false-positive rates in areas with metallic clutter,6 time and labor intensiveness,7 and operator vulnerability.8 These factors, along with operator experience and the technological capability of mine-detection technology, impact the rate of mine clearance.9
Newer approaches conduct automated surveying by remote sensing via magnetometers deployed on unmanned aerial vehicles (UAVs) to scan wider areas more rapidly and safely.10 This reduces both financial costs in terms of information-gathering and risks to personnel and equipment related to accidental detonation during on-site detection.11 Although this is a useful preliminary tool for reducing the geographical expanse and cost of ground-based surveys employed in HMA, UAVs are generally limited by weather and environmental conditions,12 though novel approaches such as using multi-sensor configurations attempt to overcome this.13 UAV surveying also requires analyzing large, complex datasets, relying heavily upon advances in machine learning (ML) to help interpret the data.14 Background noise in the data is another obstacle.15 Recent work using ML to detect and classify ordnance shows promise,16 but it is still in early phases of testing and implementation.
Given these challenges, many HMA organizations have shifted efforts toward desk-based, data-driven approaches such as NTS.17 Such approaches offer preliminary assessments to detect areas of interest to prioritize technical on-the-ground surveying.18 The inherent difficulty in UXO detection and clearance in active conflict zones19 can be augmented using these methods, given the risk of surveying areas that are traditionally considered too dangerous for intervention (i.e., along the frontlines).20 Recent efforts demonstrate the value of using open-source investigation (OSINV) for such preassessments. An innovative approach developed by The Carter Center in 2019 optimizes existing open-source data on conflict events in Syria (ACLED and The Carter Center data collections) to produce heat maps for high levels of explosive weapons use and therefore potential UXO contamination.21 The HALO Trust, one of the world’s preeminent demining organizations, recently joined forces with Esri (the organization that develops ArcGIS) to map in real time the presence of UXO and damage to residential areas or infrastructure as the Russian invasion of Ukraine unfolds.22 This includes efforts to automate mapping processes, where experts can filter through a stream of evidence instead of manually searching the internet for news articles and social media.23 Although this offers the potential to document UXO presence in current and future conflicts, munitions exist from as far back as World War I.24 The utility of The Carter Center’s approach is evident in the potential to make use of decades of existing data,25 in combination with current OSINV methods to address ERW.
Methodology and Models
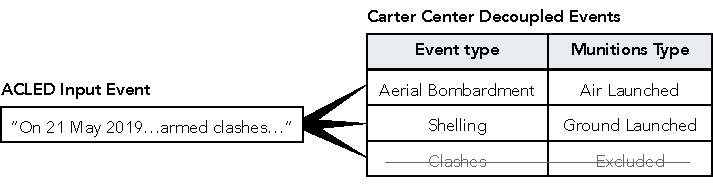
Figure 1. Visual description of The Carter Center’s process for decoupling data from ACLED.All graphics courtesy of the authors.
Explosive contaminants are a large set of deadly munitions or devices that include landmines and improvised explosives devices (IEDs) as well as ERW. ERW as a classification includes both UXO and abandoned explosive ordnance (AXO); the former fail to detonate as intended and the latter are left behind or forgotten about.
Two core databases of conflict events inform this study. The first is ACLED, which has coverage dating back to early 2017 for the whole of Syria. The second is a unique dataset collected by The Carter Center dating to 2012. Both datasets use a similar sourcing methodology based on open-source collection and multi-user verification. Key sources for both sets include the Syrian Observatory for Human Rights (SOHR)—a research network of on-the-ground journalists and activists led by Rami Abdulrahman,26 conflict event information posted by trusted accounts on Twitter, local newspapers, and video content shared on YouTube or Telegram, with The Carter Center more often leveraging the latter. These conflict events in both datasets are classified by location, date, event type, and a qualitative description of the event in plain writing.
The first and primary model we present is the OSWE model. To create this model, raw data from ACLED and The Carter Center are amended to be more optimally useful for desk study of UXO concentration.27 ACLED combines multiple explosive events (including multiple event types) in one location on one day into a single event, labeled as only the event type considered to be the most extreme. For example, an event that had artillery shelling, aerial bombardment, and armed clashes would be treated as one event marked as aerial bombardment. The additional event types are then described in the qualitative description column. See Figure 1 for a visual explaining this decoupling.
The parsing of events helps to more accurately detect potential areas and density of UXO contamination. In partnership with Microsoft, we deploy a natural language processing technique based on the BERT model28 to efficiently and broadly separate ACLED-reported events into constituent conflict events.29 We then begin by filtering data from both ACLED and The Carter Center for conflict events that deploy explosive munitions, namely aerial bombardment, shelling, IEDs, landmines, and reports of other UXO.
| Munitions Category | Sample Set Event Count | Sample Set Avg (Est.) |
| Air-Launched Munitions | 6,718 | 7.78 (8) |
| Ground-Launched Munitions | 6,250 | 9.96 (10) |
| Landmines/UXO/IED | 5,549 | 1.10 (1) |
| Miscellaneeous Other | 214 | 4.05 (4) |
| Table 1. Open-Source Weighted Estimate Model Sample Set Detail. | ||
After selecting these event types, the question of how to weigh different event types persists. A key benefit of The Carter Center’s 2012–2017 data is that it contains occasional mention of munition count estimates from on-the-ground reports30 or in some cases, explicit counting of munitions from video footage used as sourcing material.31 After cleaning the data further to specify munition counts across the data in which numbers are included, we then use each munition category (air-launched, ground-launched, IED/UXO/landmine, and miscellaneous other ) to create an estimate for each. The number of events that inform each of these estimates, as well as the mean of each sample used for each category are included in Table 1.
Next, for comparison, we create two other models derived from the same underlying dataset at the same scale. The first of these models is the conflict intensity model, traditionally the default approach for United Nations agencies and others alike.33 This model takes underlying conflict event data of all types (inclusive of clashes, sniper fire, etc.), and uses these unweighted values to assess the intensity of fighting over the course of a war in a geospatially specific manner. The final model, the UXO detonation model, pulls from conflict event data of recorded UXO detonation, excluding all other events. This is done through qualitative filtering of events based on the notes/description column of the data, selecting for events explicitly mentioning unexploded munitions, munitions exploding from previous fighting, and explosives of unknown origin.
We then run all three models at localized point-of-interest areas in Syria, which are based on an intentionally and conflict-relevant amended version of the United Nations Office for the Coordination of Humanitarian Affairs’ (UNOCHA) geolocated populated places data.34 The amendments are minor but incorporate several key areas such as critical infrastructure or military locations in addition to the civilian points of the UNOCHA dataset. We then geoprocessed latitude and longitude coordinates for territorial control points using ArcGIS’s Thiessen projection’s function,35 thereby creating polygons around each unique spatial point to estimate each location’s geographic area.36 Using a 1:1 spatial join, the results from each of the three distinct models are added to the Thiessen shapefile, providing a sum of munitions estimates for the OSWE model and a count of events for the other models.
The results for each of the three UXO data results for potential areas of contamination are normalized by the estimated polygon shape area for each location and then selected for high and low concentration estimates. These estimates are then assessed for comparative analysis of differences between the three models at a local (i.e., populated places) scale. Findings based on these comparisons are presented and discussed next.
Data Findings
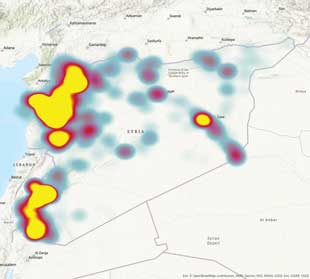
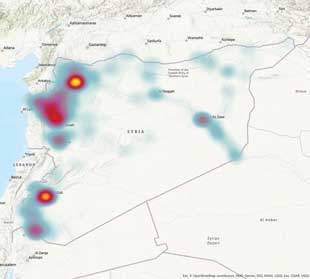
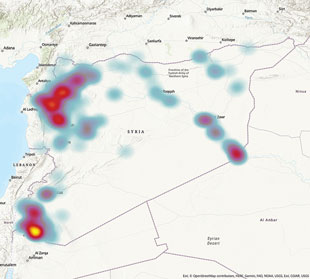
The OSWE model (left) has much higher concentration in western Syria. The conflict intensity model (center) has a bit more of a dispersed geospatial concentration. Finally, the UXO detonation model (right) is heavily skewed toward southern Syria. Viewing these models at a national scale is not as meaningful as getting into a location-based specificity, so the authors developed an analytical framework based on high levels of local concentration of explosive munitions use, conflict events, and UXO detonations, respectively.
Using these three models to assess local contamination, we then select for what we refer to as high-UXO-density locations (HUDLs)—locations that score one standard deviation above the model’s mean point value. These communities are those in which each model presents a location of imperative UXO cleaning operations.
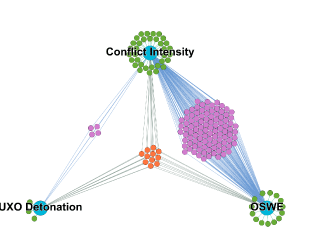
Figure 3. Visualization of shared HUDL identification by all three models. Nodes are for locations and edges are for selection in the associated model.
The three models identified different numbers of HUDLs based on levels of variance inherent within the models. The OSWE method pinpointed the broadest number of HUDLs (126), given the disproportionate level of explosives munitions use within a broad swath of key locations. Many of these locations endured long-term active frontlines or were under heavy siege for many months. The UXO detonation model determined the lowest number of HUDLs (eighteen), in large part due to the comparatively low level of data inputs.
While these three models bear some overlap in HUDL selection (see Figure 3), the findings suggest that each approach has a distinct usefulness or aim, with substantial overlap between the OSWE method and a contemporary conflict intensity method.
All three models are derived from data with significant correlation (and indeed perhaps some codeterminance if not compared and analyzed more intimately). The breakdown of locations identified by these models is shown in Table 2 (next page).
Notably, Model A (OSWE) and B (conflict intensity) had the most overlap with each other, sharing the majority of their identified HUDLs. The conflict intensity model has the most unique locations identified, a factor that we attribute to the broadness of this model’s approach as we describe earlier in this paper.
| Model | Shared with Model A (%) |
Shared with Model B (%) |
Shared with Model C (%) |
Unique Locations Identified (%) |
| Model A - OSWE | - | 112 (75%) | 11 (61%) | 14 (11%) |
| Model B - Conflict Intensity | 112 (89%) | - | 15 (83% | 34 (23%) |
| Model D - UXO Detonation | 11 (9%) | 15 (10%) | - | 3 (17%) |
| Table 2. UXO estimate model HUDL overlap. | ||||
Analysis and Implications
We conclude that the OSWE method has more optimal, precise, and expansive coverage of potential UXO contamination for current, future, and past conflicts. This is in large part due to the leverage of weighted big data approaches that underlie the desk study method. This gives our approach considerable leverage for assessing needs and directing resources in any high-level armed conflict where explosive munitions are and have been used at scale.
| Model | Count of HUDLs Government-Held (%) |
Count of HUDLs Opposition-Held (%) |
Count of HUDLs SDF-Held (%) |
Count of HUDLs Joint Government & SDF-Held (%) |
| Model A - OSWE | 117 (92%) | 6 (5%) | 2 (2%) | 1 (1%) |
| Model B - Conflict Intensity | 129 (86%) | 9 (6%) | 6 (4%) | 4 (4%) |
| Model D - UXO Detonation | 10 (56%) | 5 (28%) | 0 (0%) | 3 16 %) |
| Table 3. HUDL count by faction control. | ||||
It is also crucial to note that this is only the tip of the OSWE iceberg, as other sources for estimate weights can be applied across contexts. In the model deployed for this desk survey, we base estimates around munitions category (air-launched, ground-launched, etc.), whereas munitions type (mortar, rocket artillery, barrel bomb, airplane-launched, etc.) will provide a more granulate weighted estimate. Other methods of interpolation, such as frontline density, era of conflict, or initiating actor could allow for a compounding weighted estimate that may provide a more rigorous insight in future models.
UXO contamination is an issue that crosses frontlines and political divides, affecting large portions of Syria. Of the communities at high risk identified through the OSWE method, Table 3 identifies the breakdown of which actors control the most likely HUDLs in Syria.
Perhaps unsurprising to those watching Syria closely, the government of Syria controls the lion’s share of HUDLs in all models, in no small part due to its control over most of the territory of Syria. However, this still accounts for a disproportionate share of explosives munitions use, given that the government holds territorial claim over about fifty-five percent of all point locations tracked by The Carter Center and about sixty-four percent of the total territory. Part of this high concentration of likely UXO contamination in government-held territory has to do with the protracted conflict and heavy besiegement of many territories retaken by the government, especially between 2017 and 2018.
Another crucial component of the OSWE method is that in addition to providing a count and percentage of HUDLs held by each territory-holding actor in Syria, it allows for an estimated count of munitions within each actor’s held territory. Table 4 identifies this breakdown by each of the three major actors.
| Count of HUDLs (%) | Total Territory Held in SQKM (%) |
Estimated Count of UXO (%) |
UXO Density in UXO per (SQKM) |
|
| Government -Held | 117 (92%) | 118,869 (64%) | 757,689 (79%) | 6.4 |
| Opposition-Held | 6 (5%) | 11,174 (6%) | 145,369 (15%) | 13.0 |
| SDF-Held | 2 (2%) | 46,087 (25%) | 33,146 (3%) | 0.7 |
| Joint Govt & SDF-Held | 1 (<1%) | 2,939 (2%) | 24,643 (3%) | 8.4 |
| US-Held | 0 (0%) | 6,759 (3%) | 14 (<1%) | 0.0 |
| Table 4. OSWE model detection of UXO by faction. | ||||
Using the results from the OSWE model helps assess contamination for areas controlled by different actors in Syria, allowing HMA organizations with access to only one actor to assess needs across their accessible territory. Table 3 indicates that the government of Syria controls many HUDLs through all three model approaches; the OSWE can give useful insights about the density of explosive weapons use and likely UXO contamination that follows. Using this approach, we find that the territory holder with the highest likely UXO density is the armed opposition, who have almost twice the likely level of contamination as the government of Syria on the aggregate. Notably, the opposition only controls about six percent of all territory by area and about sixteen percent of all settled locations.
One final example assessing HUDLs and areas of control by the major factions in Syria’s war has to do with the frontlines in Syria. A major hurdle identified both in the literature and in conversations we had with HMA personnel pertains to the aforementioned security risks associated with frontlines. Filtering these three models for locations that are at least fifteen km from a frontline allows for selection of both high-density areas for clearance and those that are more accessible to technical survey and clearance teams. This can be accomplished by using The Carter Center’s previously discussed geolocated dataset on territorial control in Syria. The previously described Thiessen polygons are created by estimated midpoints between neighboring locations. Dissolving these point-centered polygons based on an aggregated feature, in this case “armed group in control,” allows for creating larger polygons that denote areas of control for each month in the conflict, resulting in a highly accurate and dynamic estimate of frontline locations. Using the proximity function, the distance from each location point to the boundary of neighboring polygons controlled by opposing armed factions allows for estimating distance from the frontline, or more than one in cases where multiple fronts are colliding. In turn, it is possible to assess how geographically concentrated locations are within conflict zones.
See Table 5 for information about how each of these three models interacts with this filter for HUDLs at least fifteen km away from a frontline.39 As of June 2022, 5,127 locations (points of control) are at least fifteen km from a frontline (or sixty-three percent of Syria).
| Model | Count of HUDLs (%) | Primary HUDL Holder, by Count (%) | Primary Governorate, by Count (%) |
| Model A - OSWE | 100 (79%) | Government, 117 (93%) | Aleppo, 57 (45%) |
| Model B - Conflict Intensity | 92 (61%) | Government, 129 (86%) | Aleppo, 70 (47%) |
| Model D - UXO Detonation | 18 (100%) | Government, 10 (56%) | Aleppo, 5 (28%) |
| Table 5. Model comparison, filtered by location 2+ degrees from a frontline. | |||
Combining such analysis with the OSWE method illustrates how impactful such a method could be for those directing the difficult work of technical surveys and eventual UXO and mine clearance projects while safeguarding the safety of their staff.
Conclusion
It is crucial to note that this methodology is still in development. This paper builds upon a few years of data collection and analysis, but The Carter Center is continuing to hone this methodology. We aim to ensure that the method is easily replicable in other contexts, and indeed a similar approach is now being used by others in the field today. As noted, HALO is partnering with Esri to utilize open-source data to anticipate UXO clearance needs in Ukraine as the war there unfolds. Development of this theoretical desk study method, as with any method for determining likely UXO density and clearance need, is directly connected to saving the lives of civilians who have already endured a brutal conflict.
The Carter Center is expressly interested in working with HMA organizations to continue developing methods to improve and make the explosives clearance process more feasible and efficient. Relatedly, this method could be tested in the future against UXO clearance data—checking the newer OSWE method against legacy desk study approaches. With access to that responding data, analysts will be able to run tests measuring direct applicability of this method to continue to assess biases in the data and its methods.
The views expressed in this article do not represent the authors’ current or previous employers.
 Hampton Stall
Senior Program Associate, Data and Analysis Team
The Carter Center
Hampton Stall is a Senior Program Associate with The Carter Center’s Data and Analysis Team, working at the nexus of data, peacebuilding, and humanitarian response. He earned a BA with Honors in political science from Davidson College and an MA in applied anthropology from Emory University. His research interests center on paramilitarism in conflict and post-conflict environments.
 Jennifer L. Hudson
PhD Candidate, Security Studies
University of Central Florida
Jennifer L. Hudson is a PhD candidate in security studies at the University of Central Florida (UCF) and a data analyst intern at The Carter Center. Hudson received an MA in political science from UCF. Hudson’s doctoral research centers on the relationship between wartime military strategies and territorial control shifts in civil war, with a focus on armed groups’ use of civilians as weapons of war and governance amidst civil conflict.
 Evan Leendertse
Data Analyst, Data and Analysis Team
The Carter Center
Evan Leendertse is a Data Analyst focusing on data sourcing, analysis, and visualization. Within the Data and Analysis Team at The Carter Center, Leendertse works to translate data into insights.
 Hari Prasad
Program Associate, Data and Analysis Team
The Carter Center
Hari Prasad is a Program Associate and Researcher with the Data and Analysis Team at The Carter Center focusing on tracking the dynamics of the Syrian conflict. He earned an MA from George Washington University where he focused on Middle East and South Asian Politics and Security.
 Chris McNaboe
Field Manager, Syria Team
The Carter Center
Christopher McNaboe is a Field Manager for The Carter Center’s Syria team within the Conflict Resolution Program. He earned an MA from Middlebury Institute of International Studies in International Policy Studies focused on Conflict Resolution.
 Rana Shabb
Middle East Associate Director
The Carter Center
Rana Shabb is the Middle East Associate Director in The Carter Center’s Conflict Resolution Program. She earned a BA in quantitative economics and international relations from Tufts University, a Master of Science in foreign service from Georgetown University, and a PhD in international affairs from the Georgia Institute of Technology’s Sam Nunn School of International Affairs. Her research interests center on international development, specifically focusing on the connection between the private sector and conflict longevity and peace.
 Jonathan Robinson
Humanitarian Advisor
Brown University's Center for Human Rights & Humanitarian Studies
Jonathan Robinson is a global fellow at Brown University’s Center for Human Rights and Humanitarian Studies (CHRHS) and a contracted humanitarian operations specialist supporting a professional military education institution in New England. Since 2018 he has specialized in data and its application in HMA, having previously led The Carter Center’s Explosive Munitions Use in Syria Project, as well as supported Caritas Switzerland, The HALO Trust, and the International NGO Safety Organization (INSO) in the Middle East over the past ten years. Robinson holds an MS from the University of Edinburgh and a BA with honors from Durham University.