
Proof: How TIR Imaging Can Locate Buried Cluster Munitions in the Iraqi Desert
By John Fardoulis [ Mobility Robotics ], Xavier Depreytere [ Humanity & Inclusion ], Jonathon Guthrie [ Norwegian People’s Aid ]
CISR Journal
This article is brought to you by the Center for International Stabilization and Recovery (CISR) from issue 25.3 of The Journal of Conventional Weapons Destruction available on the JMU Scholarly Commons and Issuu.com.
In this article, we follow on from our previous work published in The Journal of Conventional Weapons Destruction that proved how buried thirty-year-old legacy anti-personnel and anti-tank landmines could be located using thermal infrared (TIR) sensors in the Sahara Desert, northern Chad.¹ This time, the emphasis is on proving how the location of buried submunitions from cluster munition strikes in the desert of southern Iraq can be identified using TIR sensors.
Work took place as part of the Humanity & Inclusion (formerly Handicap International, HI) Odyssey 2025 Project, partnering with Norwegian People’s Aid (NPA) and Mobility Robotics.
HMA Scope
Explosive hazards exist in large parts of southern Iraq from cluster munition strikes that took place during the Gulf War.2,3 Thirty years later, areas are still littered with unexploded submunitions, which cause casualties throughout the region, and it could take decades to clear contamination using current practices. To address this problem, we are evaluating the potential from new technology and methods to accelerate the land release process, make operations safer, and save costs.
To the best of the authors’ knowledge, the baseline TIR field study in October and November 2021 was the first to capture real-world data from a civilian TIR sensor in a legacy cluster strike location in the desert.
The scope of work was clear:
- Could a TIR sensor capture thermal anomalies emitted from buried submunitions found in the Iraqi desert? If not, that would be a break point in terms of applied, real-world research.
- If 1. was possible, when do thermal anomalies from buried submunitions appear? The approach was empirical—observation based, not theoretical.
The concept is to work on a progressive, evidence-based model, achieving each milestone before moving to the next step. Anomalies in this article represent surface temperature anomalies above buried targets as captured by a TIR camera. Noticing any weather or other trends that affect when anomalies appear is a bonus. Separating the degree of influence that each of the many complex variables has on making thermal anomalies appear or forecasting potential efficiency gains if such a sensor was deployed in routine operations is beyond the scope of an initial baseline sensor field trial.
For now, we are concentrating on when anomalies from buried targets are visible to the TIR camera—parking most of the complex science behind what makes the anomalies appear to the sensor for later and adopting a black box philosophy regarding why such phenomena takes place.
An important reason to translate complex science into a simplified observation-based methodology is to encourage other HMA actors to also capture baseline TIR sensor data regarding each type of explosive hazards found in arid and perhaps semi-arid locations where they work. The same methodology that we have used for cluster munitions can also be used to determine if sensors can capture TIR anomalies from buried landmines, buried improvised explosive devices, or buried explosive remnants of war. This article endeavors to not only present findings but to also share information about the process so that other HMA actors can replicate such methodologies.
The reason for observing when TIR anomalies appear is for insight regarding when such a sensor may be used operationally in the future. A current way to remotely capture survey data in suspected hazardous areas (SHAs) and confirmed hazardous areas (CHAs) without people having to enter the hazard area is by flying cameras on unmanned aerial vehicles (UAVs)—also known as small drones. Flying TIR sensors on UAVs to locate buried contamination would be the long-term goal, if they prove viable in the real-world. Currently UAVs are mostly used in HMA to capture daylight imagery, looking for direct evidence and/or ground-sign indicators.4 Going beyond what is visible on the surface has led to our field trials in post-conflict locations to capture real-world evidence as part of a process in determining how practical and effective TIR sensors can be in dealing with buried targets in the desert.
Hypothesis
Buried submunitions interfere with how thermal energy is stored in and travels through the ground, creating hot or cold patches on the surface above buried objects. The different surface temperature above the buried target is an anomaly, an indicator that contamination may exist beneath. The strength and timing of when a hot or cold patch appears during the day or night depends on many complex factors such as the target’s physical properties as well as weather and environmental variables at the time.1,5–9
Materials & Methods
We recorded high temporal and spatial resolution thermal anomaly data from targets buried to known depths by a TIR camera mounted at a fixed height to assess sensor capabilities in identifying the presence of sub-surface submunitions. The automated baseline TIR field test site continuously captured data at one-minute intervals over twenty-four-hour daily (diurnal) cycles during an autumn season.
Ground Composition
This article focuses on the performance of a TIR sensor in capturing temperature anomalies from buried targets in sandy ground. A second study also took place during the same field mission with targets buried in hard, compacted ground found at a second cluster munition clearance site approximately 10 km away. While important to keep track of the soil type as a relevant variable, many other complex variables are also at play, and it is too early to make predictions based on one variable alone with results from one location. However, soil samples were collected for future analysis, as was the case during our baseline TIR field study in the Sahara Desert, Chad.
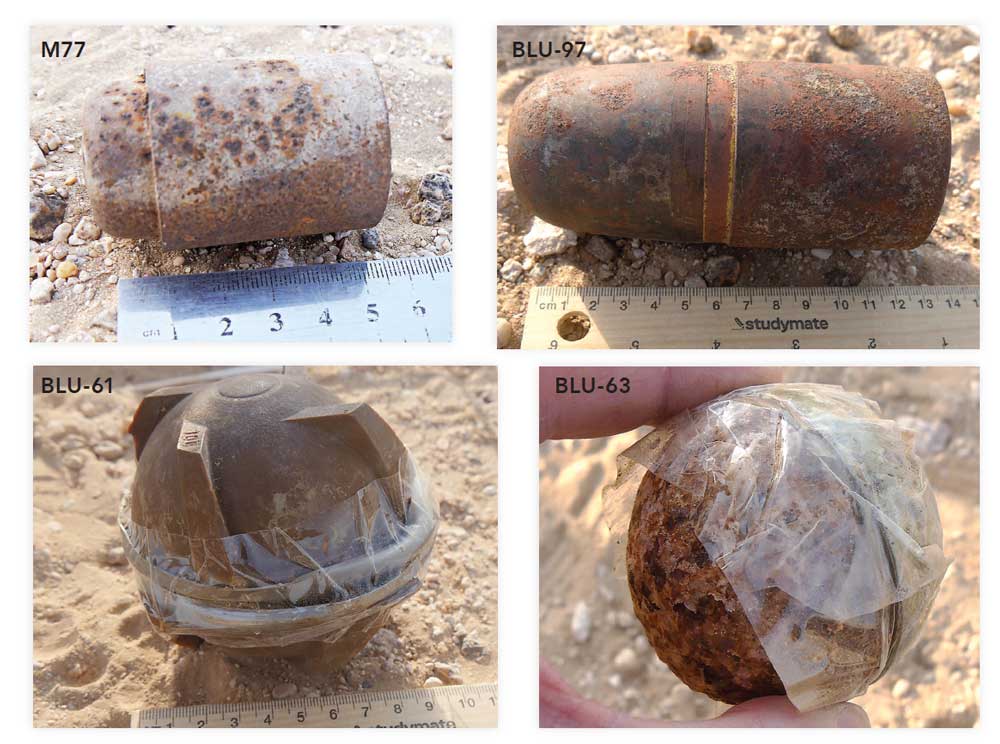
Targets
Targets were thirty-year-old legacy,11 weathered, steel production submunitions recovered from the surrounding region. The relatively thick, metal inner section of BLU-97 submunitions (not the outer casing, spider, or parachute) were used for buried targets of that model because that is what was available, and it is the heavy section that does not move in the desert. Targets were free from explosives (FFE), which may exhibit a difference in TIR responses to legacy, buried targets containing explosive fills.
Baseline TIR Field Site
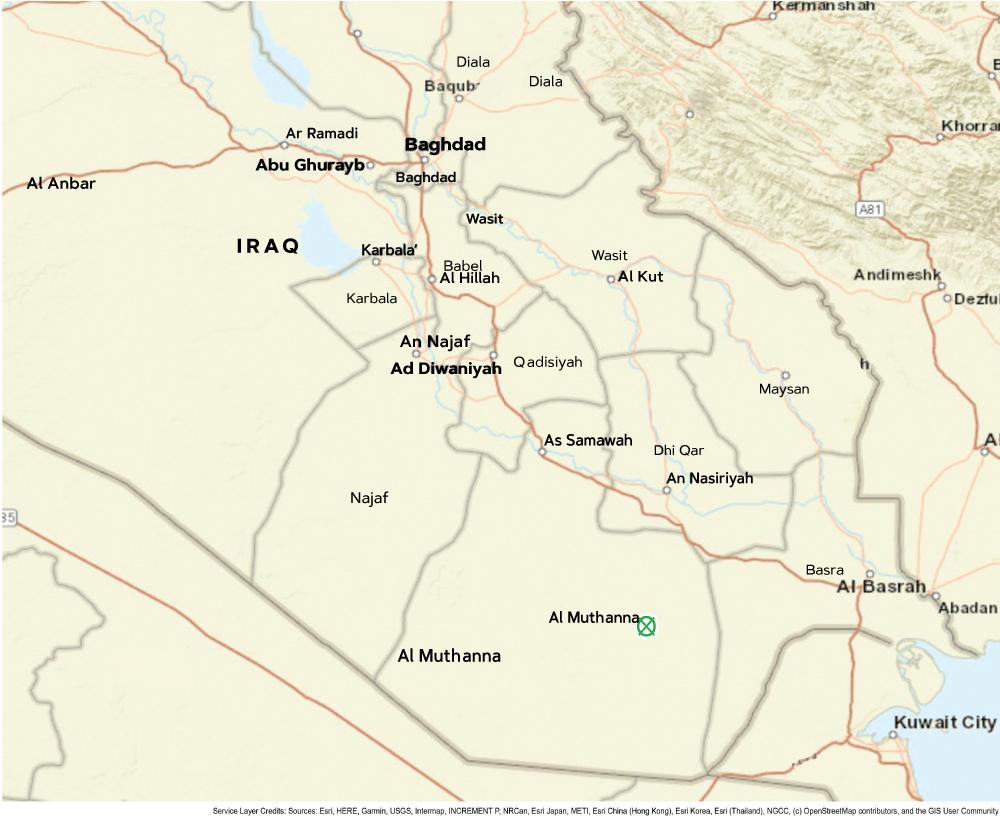
The baseline TIR field test site was established in the vicinity of Al-Bussayah village, Muthanna, Iraq. The baseline site was set up on land previously contaminated by cluster munitions but cleared, approximately 300 m from an active cluster munition clearance site.
A grid of thirty-five 30 x 30 cm boxes was established at the baseline field test site, with the TIR camera covering that footprint from a 4 m height. Targets were buried in the hard ground three weeks prior to the study, giving them time to settle. Based on past experience with coarse sand in the Sahara Desert, Chad, we buried targets one day prior in soft stand. A hole was dug and refilled in one cell as a control for each ground type, and a large stone was placed on the surface in a cell as a control during the hard ground study.
Equipment and Software
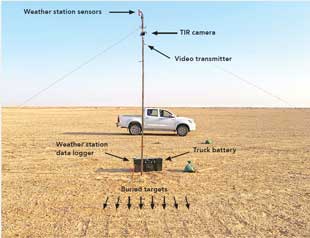
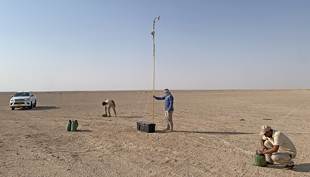
Commercially available equipment and sensors were utilized. Mounted on a 4.5 m high mast (Figure 3), a FLIR Duo Pro R TIR camera with a 13 mm lens11 captured images every minute.
A consumer-grade weather station,12 with sensors mounted on the mast above the TIR camera, recorded meteorological data. The power source was a 200 Ah truck battery, which was swapped out every five days. FLIR Tools13 and Microsoft Excel14 were used for data presentation.
Results
Temperature anomalies emitted from submunitions captured by the TIR camera could identify the position of buried targets in the Iraqi desert not visible to the naked eye.
Characterizing TIR Anomalies
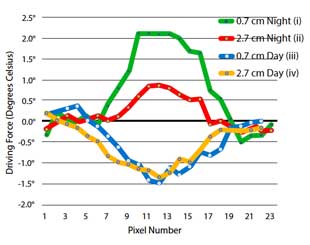
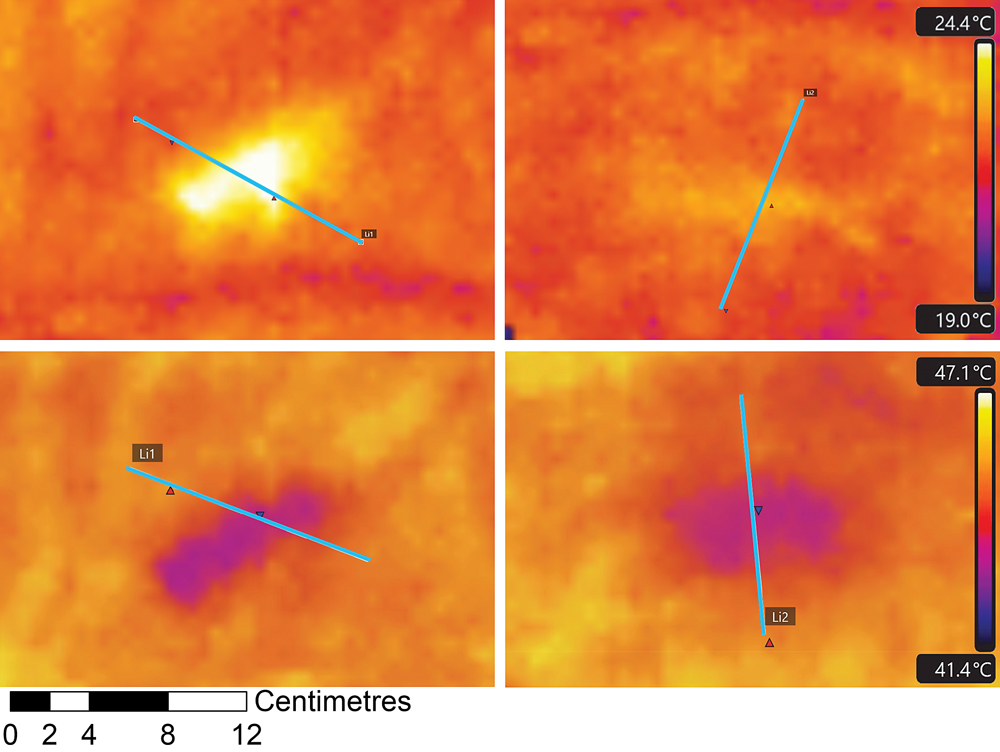
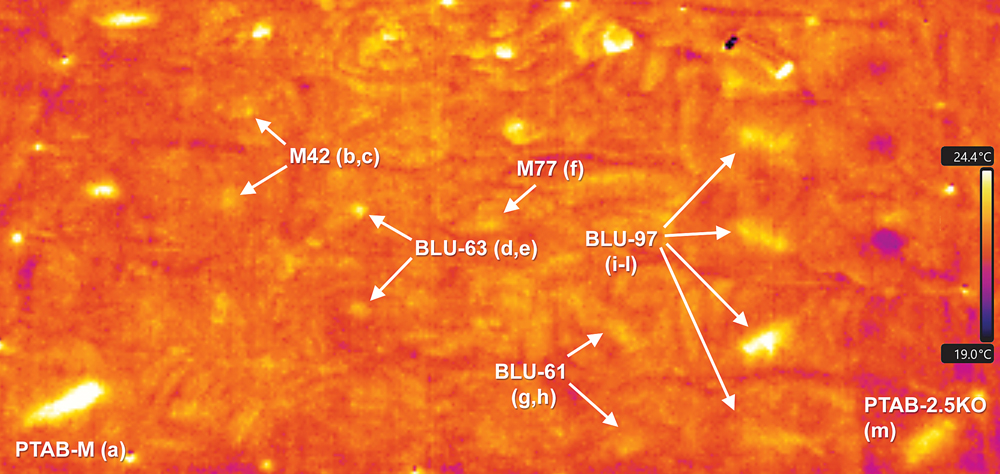
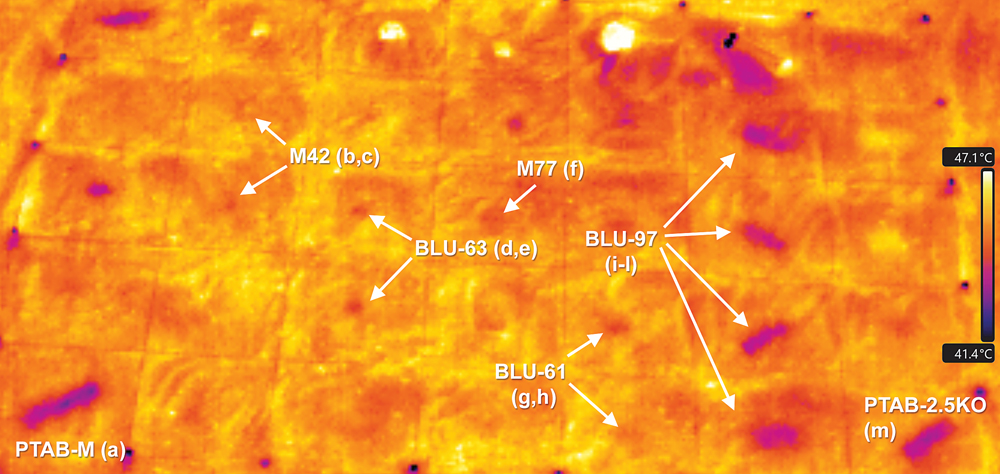
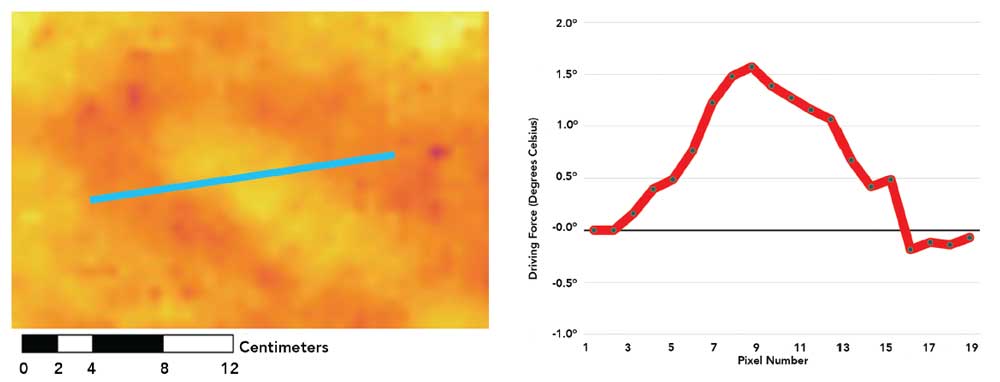
This paper presents TIR anomalies from buried targets in two ways. First, we show copies of thermal images directly from the TIR camera’s memory card for either the whole grid area, such as in Figure 6 and Figure 7, or by cropping the data to focus on individual targets. The second way that anomalies are visualized is by showing a surface temperature slice as a graph of the cross-sectional profile of temperature change (driving force) caused by the TIR anomaly—e.g., in Figure 4 and explained in more detail in Figure 5. The position of where the temperature slice was taken is indicated by a blue line across the anomaly in the associated TIR image.
The intensity of each anomaly is greater for shallower targets, indicated by the strength of the driving force as shown on the y-axis in Figure 5. The shape of each line in the graphs also provides an idea about the rate of change in temperature, which can affect how obvious an anomaly appears—i.e., the anomalies appear duller from deeper depths, as shown in Figure 4, where cells (ii) and (iv) are duller than (i) and (iii), which corresponds with lines in Figure 5. Examples of thirteen different thermal anomalies from buried targets captured by the TIR camera at night are shown in Figure 6. Figure 7 shows thermal anomalies from the same thirteen buried targets during the day, with Table 2 listing the depth of each target.
Day Versus Night
Temperature anomalies from buried metal submunitions used in these trials appeared cooler than the surrounding surface during the day, and appeared hotter than the surrounding surface during the night.
While visible for most of the night, anomalies from buried submunitions were evident during the day but only for a limited number of hours. In some cases, the amount of anomaly thermal contrast was better at deeper depths during the day. For example, the anomaly from the BLU-97 buried at 2.7 cm is more evident during the day than the night (Figure 4 [iv] vs [ii], and Figure 5 [iv] vs [ii]).
Best Times to Operate
After selecting a large and small submunition as reference targets to summarize when anomalies were visible, we reviewed 360 TIR anomalies at thirty-minute intervals over four nights and three-and-a-half days. A BLU-97 buried at a depth of 2.0 cm, which also acted as a proxy for the two BLU-97 targets at shallower depths of 0.7 cm and 1.3 cm was the large submunition reference target; a M77 buried at 1.0 cm was the small submunition reference target. The visibility of anomalies from reference targets in TIR images were ranked visually, each assigned a category by a trained eye using a simple data review method suited to a long-term goal of building capacity for future studies to be led from in the field. The three categories are: visible to the TIR camera (shown in Tables 3–6, 8, and 9 as green), weak (orange), and not visible (red).
More advanced graphs showing anomaly surface temperature gradients are presented in this article as a training aid, but a long-term goal is to democratize the use of baseline field test sites and not overwhelm HMA field personnel with burdens regarding data analysis. The most important outcome is for trained personnel to note when anomalies are clearly visible (the green category), which provides insight into when to operate in the future. Tracking times when anomalies are weak could be optional, leaving times when they are not visible blank. This concept of simplified TIR anomaly interpretation was first prototyped with indigenous HMA field staff in Chad.
Table 3 shows that a TIR anomaly from the BLU-97 reference target was consistently visible during the night, apart from being weak for a few hours on the first and second nights, and towards the end of the fourth night.
Table 4 shows that a TIR anomaly from the BLU-97 reference target was visible for up to four hours during the day from late morning, apart from the morning of the fourth day when it was windy.
Table 5 shows that a TIR anomaly from the M77 reference target can be seen for most of the time during some nights, but visibility was patchy on the first two nights and towards the end of the night during the last two nights.
Table 6 shows that a TIR anomaly from the M77 reference target can be seen at around the middle of the day, but visibility can be patchy. The amount of time that anomalies from the M77 reference target were visible during the day was considerably less than for the larger BLU-97 reference target for the same period.
Comparing thermal anomalies from the two different reference targets, M77 visibility was patchier than that for the BLU-97. Generally, anomaly visibility was most consistent at night. However, other variables were at play that affected the anomaly strength other than a twenty-four-hour diurnal cycle, weakening the apparent anomaly strength at times during some nights.
Better thermal contrast may be visible for some anomalies during the day (e.g., BLU-97 targets in Figure 4 and Figure 7), but the operating window during the day is more limited, particularly for the M77.
Wind Gusts
After identifying inconsistencies in anomaly visibility during the same time slots on different nights and days, we checked wind speed data for those times. Figure 8 shows wind gust data recorded by the weather station for the length of the study. Next to labels (a)–(c) in Table 3 are times of weak anomaly visibility for the BLU-97 reference targets during the night. The same times as Table 3 (a)–(c) have been marked on the wind gust chart (Figure 8), with a trend seeming to be that the visibility of the BLU-97 anomalies deteriorate as nightly wind gusts increase. Similarly, times when anomaly visibility was good have been labelled as (d) and (e) in Table 3, which corresponds with times of low wind gusts, marked as (d) and (e) in Figure 8. The threshold between weak and visible wind gusts in Figure 8 (b), 8 (d), and 8 (e) was when wind gusts dropped below approximately 10 kph. Other factors may have contributed to anomaly visibility, and weather station instruments were not calibrated to scientific standards, so care must be taken if quoting absolute metrics.
TIR anomalies from the BLU-97 reference target show similar trends during the day, with wind gusts dropping at around 11:00–12:00 on Day 1 to Day 3, corresponding with when green boxes appear near the middle of the day in Table 4. The M77 reference target seemed more sensitive, following similar trends, but was visible for less time.
TIR Anomaly Signatures by Submunition Type
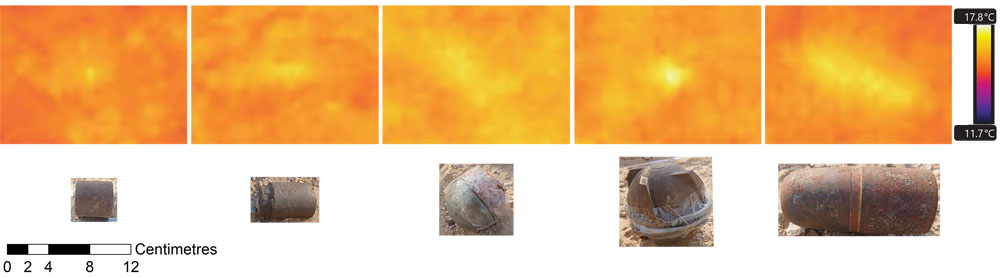
The strength and size of anomalies varied by submunition type. Spherical targets showed smaller anomaly sizes spatially, with the shape of each anomaly roughly corresponding with a submunition’s top surface when covered by sand. The hypothesis was that as the target was closer to the surface, its visibly would increase. TIR anomalies were stronger for the larger BLU-61 than the BLU-63 spherical submunitions. BLU-97 and PTAB submunition TIR anomalies were long and rectangular in shape, as they are relatively large cylindrical targets that were buried horizontally.
Figure 9 shows examples of typical TIR anomalies at night with photos of each submunition below to compare with the physical properties of targets. The amount of metal in each submunition also varies, which could affect heat storage and thermal transfer properties. Regarding the approximate amount of metal content found in each submunition target, (small) M42s and M77s contain 130 g (medium) BLU-63s contain 300 g, and large BLU-61s and BLU-97s contain 700 g.
Variability in Anomaly Strength and Trends by Depth
Table 3 to Table 6 provide insight regarding the variability of anomaly strength for the large and small submunition reference targets during different time slots.
The TIR anomaly strength can also vary at the same time on different days or nights. For example, anomalies from four buried BLU-97 targets were strong at 06:00 on Night 1 (left column, Figure 10 [a]–[d]) but noticeably weaker at 06:00 on Night 4 (right column, Figure 10 [e]–[h]). The difference in TIR anomaly strength also affected the depth at which they were visible, i.e., BLU-97 TIR anomalies can be seen up to a depth of 2.7 cm at 06:00 on Night 1 (Figure 10 [d]) but are clearly visible only up to a depth of 1.3 cm at 06:00 on Night 4 (Figure 10 [f]).
Graph (i) compared to (ii) in Figure 10 shows the anomaly cross-sectional temperature changes that substantiate such an interpretation, where a driving force greater than 0.5 degrees Celsius was required for an anomaly to be visible in this example.
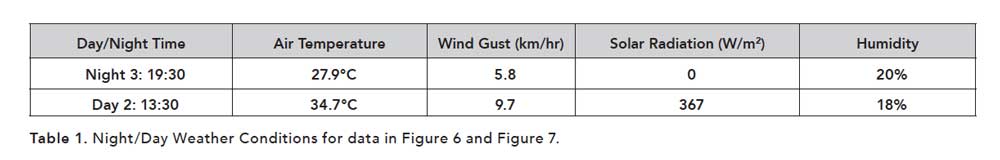
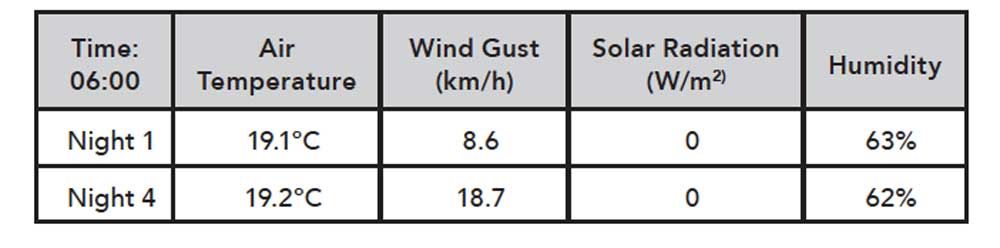
Weather data from 06:00 on those two nights (Table 7) shows that the air temperature and humidity were similar but there was a noticeable difference in wind gust speed. This matches the observations in Table 3 against wind gust data in Figure 8 for (orange) weak anomaly strengths when wind gusts increased. Figure 4 also shows that there can be variations in how deep TIR anomalies can be seen at different times. A BLU-97 anomaly 2.7 cm deep was visible at 13:30 on Day 1, compared to being barely visible at 19:30 on Night 3.
Target physical properties can also affect the depth at which TIR anomalies are visible. A BLU-61 buried at 2.8 cm (Figure 6 [h], Figure 7 [h]) appears barely visible, compared to the larger, visible BLU-97 buried at 2.7 cm (Figure 6 [l], Figure 7 [l]).
Generally, during favorable conditions, the deeper targets produced anomalies that seemed more dull or hazy, in some cases spanning a larger spatial area but at a lower intensity than that of a shallower target of the same model. For example, Figure 4 (iv) versus (iii) and Figure 10( d) versus (c) show how anomalies from a BLU-97 at 2.7 cm are duller, with responses more dispersed off to the sides than those from a BLU-97 buried at 0.7 cm.]
Different Ground Composition
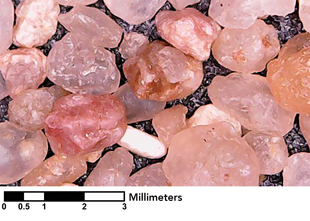
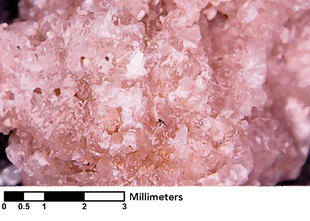
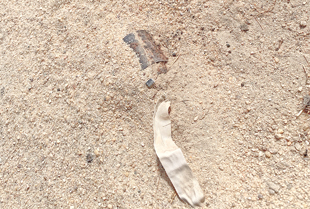
As mentioned, a second baseline TIR study took place during the same mission, in hard, compacted, crystalized ground (Image 3). The second baseline study ran for seven twenty-four-hour periods. Data presented thus far is from ground found at a cluster munition clearance site approximately 10 km away from the hard ground site, where targets were buried in soft, grainy sand (Image 4). Image 3 and Image 4 illustrate how both ground types looked different under magnification.
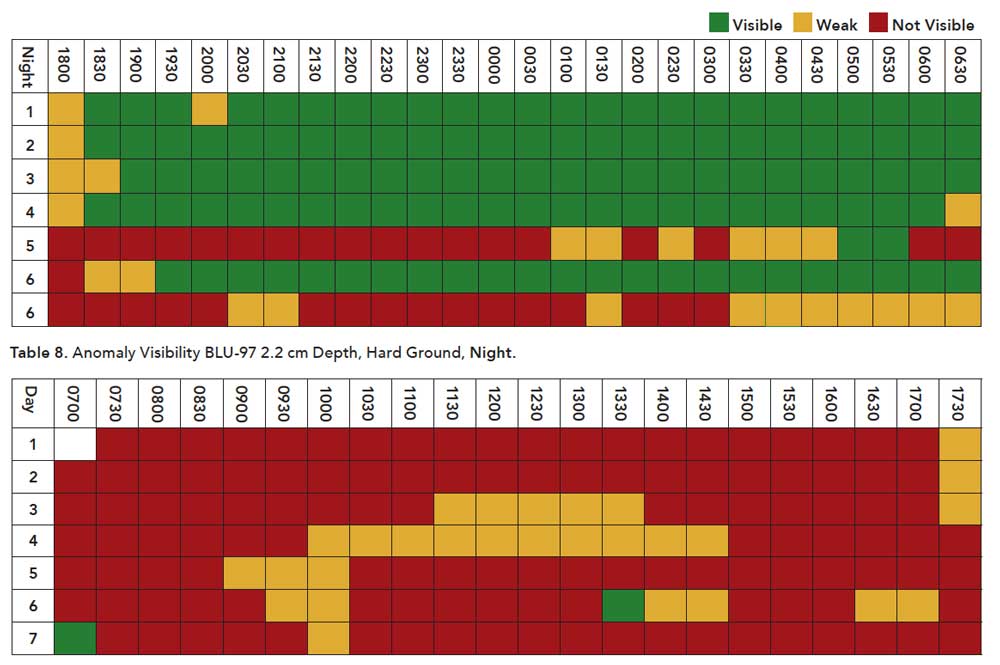
Using a BLU-97 buried in hard ground at a depth of 2.2 cm as a reference target (Figure 11), 336 anomalies were ranked at thirty minute intervals into categories of visible (green), weak (orange), and not visible (red), just as in Tables 3–6. Table 8 and Table 9 display a visibility summary for the BLU-97 reference target in hard ground found near Al-Bussayah.
TIR data showed that during the day, the sandy ground produced clearer TIR anomalies for the BLU-97 reference target compared to the same reference target buried in hard, compacted ground. Trends were similar between sandy and hard ground for TIR anomalies at night, where anomalies were visible most of the time, as can be seen in Table 8.
Reviewing weather data during times when anomalies were either weak or not visible at night in hard ground showed the same trend as in sandy ground—that an increase in wind gusts had a detrimental effect on TIR anomaly visibility from buried targets.
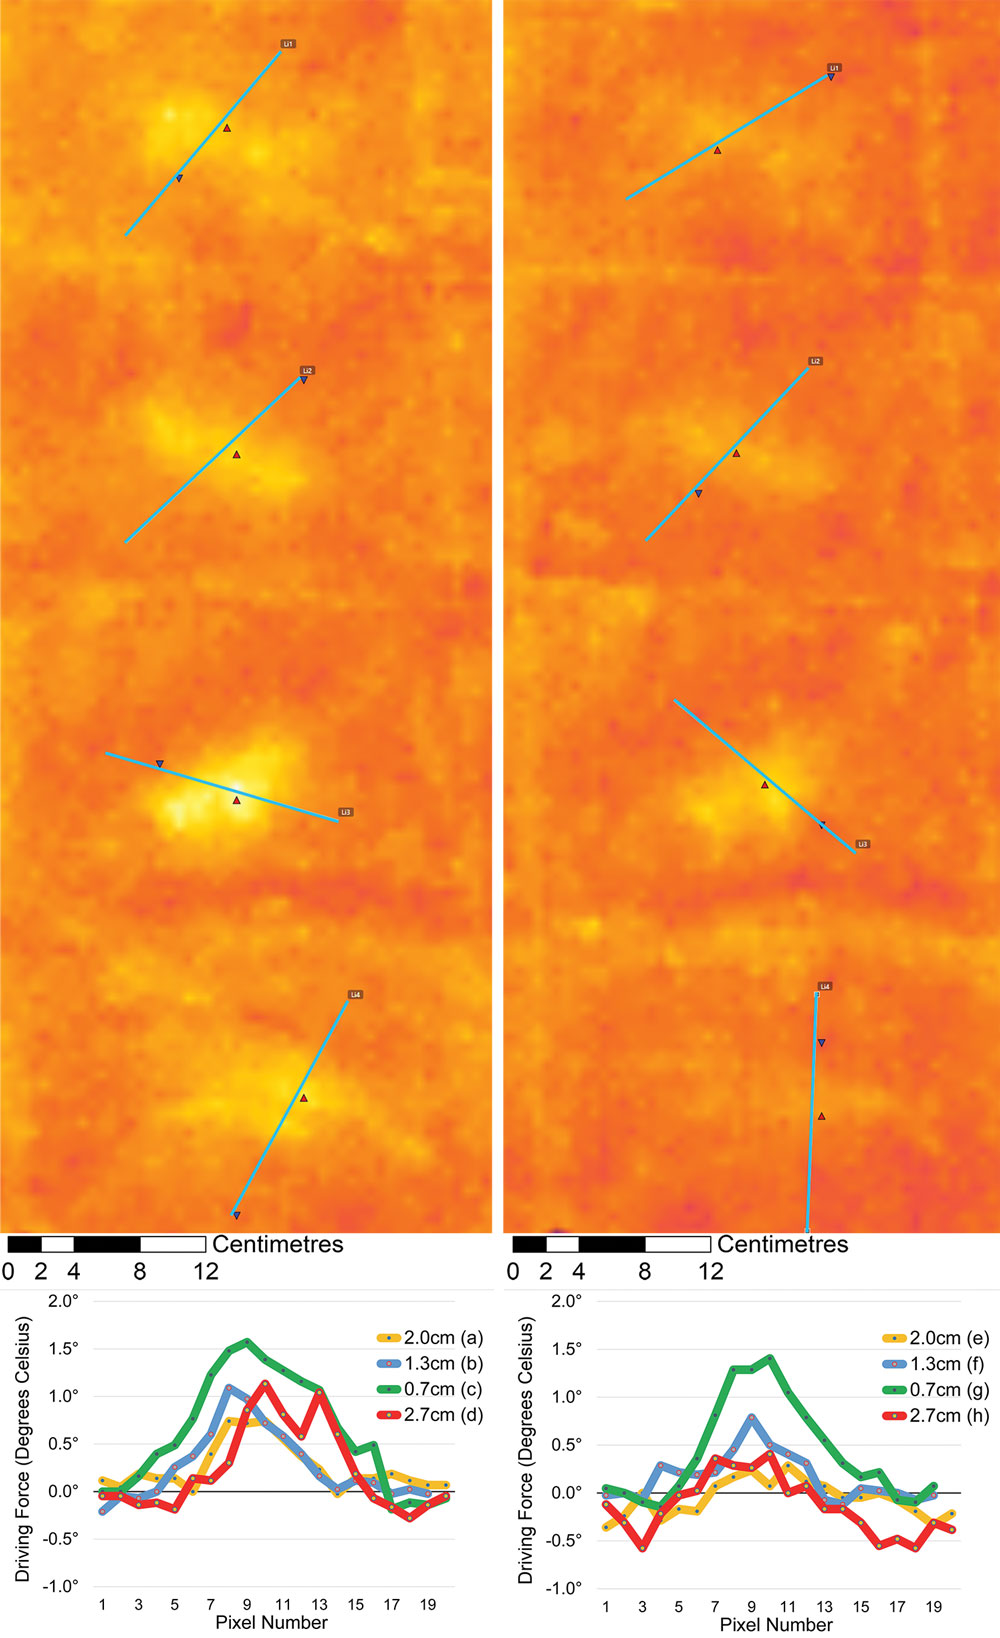
Targets were buried at the following depths: Figure 10(a) and (e) 2.0 cm, (b) and (f) 1.3 cm, (c) and (g) 0.7 cm, (d) and (h) 2.7 cm. Graphs (i) and (ii) below present a cross sectional perspective of the strength of each anomaly (driving force) in degrees Celsius. The visibility threshold in this example seems to be a driving force greater than 0.5 degrees Celsius.
Discussion
We proved that thermal anomalies emitted from buried targets not visible to the naked eye or regular daylight cameras can be captured by TIR cameras to indicate the location of buried submunitions in the Iraqi desert.
In order to share anomaly characterization data, we visualized forty-two different TIR anomalies from weathered targets buried at our baseline field test site. Additionally, we summarized findings to suggest optimal operating times in the Iraqi desert by analyzing 696 TIR anomalies, presenting the summary in Tables 3–6 and in Tables 8–9. These summaries show that TIR anomaly visibility varies by time of day and submunition model, and indicates that buried submunition targets could be seen for most of the night, apart from when it was windy. Performance-affecting factors such as wind gusts can also affect the visibility of TIR anomalies on a day-to-day basis.
An interesting new finding was that daytime anomalies from buried submunition targets were visible to the TIR camera in a sandy environment for three to four hours each day during favorable conditions. In some cases, there was better thermal contrast in sandy ground during the day than at night. This is encouraging because of increased risks as well as difficulties in gaining permission to work at night.
Although too early to predict where else a TIR sensor may or may not be viable based on results from soil types found in the Muthanna Province in Iraq, anomalies were visible in two substantially different soil types. Thus, our recommendation is to test on a case-by-case basis until proof is collected from many other locations. A time to conduct a dedicated soil comparison study might be when samples are collected from baseline trials in more than ten different countries or regions.
Addressing false alarm rates and blind tests were not within the scope of an initial controlled sensor baseline field study. Because we used thirty-year-old weathered production targets harvested from contaminated sites in the region instead of surrogate or simulant targets, a target legitimacy study was not required. Moreover, because work did not take place in a research location outside of Iraq, an environment and meteorological legitimacy study was not required.
A logical question from HMA field personnel is how deep such a potential tool might work. This includes many complexities only touched upon in the results section. A dedicated baseline study is required to address that question. Further study is also required regarding whether to bury large cylindrical submunitions such as the BLU-97 and PTAB vertically or horizontally.
Running a second baseline field study in hard compacted ground proved that TIR anomalies could be identified in a geophysical environment other than just soft sand. Hard ground with a heterogenous surface is a more complex environment. It is likely to add more challenging variables such as potential differences in heat transfer through a crusty, compacted surface, and perhaps a potentially significant false alarm rate from competing surface objects such as stones that may exhibit similar thermal profiles to anomalies from buried targets.
We suspect that all the factors have varying influences on the strength and timing of thermal anomalies from buried targets seen by the TIR camera. These include variables such as
- air temperature (and changes/rate of change throughout the diurnal cycle)
- wind (constant speed or gusts)
- depth, target orientation
- sun (solar radiation), cloud
- soil (composition, mineralization, particle size and characteristics, color, proportion of organic matter, and surface characteristics)
- target (materials, surface area, shape, wall thickness, fill substance, and cavities).
Variables may also include humidity, ground moisture, terrain, or other factors that we have not recognized yet, acting individually or on a compounded basis. A benefit of conducting a real-world field study is that all the major variables are likely to be in play—reducing the chance of omitting any factors that might have a significant impact on performance.
Whether TIR-equipped UAVs can add value beyond current cluster munition land release procedures is a question for the future. The first step is documenting the real-world capabilities and limits of the TIR sensor. This was achieved automatically by recording data twenty-four hours a day, seven days a week from the static mounted TIR camera at the baseline field site, a feat not possible at such high temporal resolution when flying TIR equipped UAVs.
Conclusions
The studies in two different ground types proved that TIR imaging can be used to locate sub-surface cluster munitions at a controlled location in the Iraqi desert. The strength of thermal anomalies can vary by day, indicating that generalizations cannot be made without more field data to substantiate claims. The first, second, and third priorities should be more field data collection either at or within close proximity to legacy contaminated areas.
We have a pathway to move forward: to get on with the job in a practical way by gathering real-world field data to decide if and when to operate TIR-equipped UAVs as an enhanced HMA survey tool. There is no panacea; merits must be judged on a case-by-case basis for different types of contamination and each natural environment—in arid and perhaps semi-arid locations.
Future Work
Our embedded field trials took place under a HMA banner, meaning that a practical impact-driven approach needs to continue. Working with UAV daylight imagery at simple and advanced levels will remain the core foundation for activities, expanding across additional countries. TIR field work both complements this and spearheads new ways of using UAV technology for HMA. More empirical data is required such as UAV TIR data from live CHA sites and gaining more knowledge, particularly regarding factors such as depth limits, the influence of ground composition, and seasonality in specific locations.
We are currently setting up more baseline TIR test sites in the Middle East. Studies will run simultaneously with UAV mapping using standard cameras. Studies may run for a few days (for a quick snapshot) or several weeks (if trying to identify weather trends) depending on budget and logistical constraints each time.
By setting up multiple baseline TIR field test sites around the globe, the HMA community can scale up efforts to determine the viability for TIR sensors on a more widespread basis. This can be achieved through projects that involve technical experts and HMA operators collaborating together in the field.
For more information see https://www.mr-au.com. ◊
Acknowledgements
We would like to thank a number of people and organizations who made the Odysessy2025 Project possible, including our donor, the German Federal Foreign Office. The Directorate of Mine Action in Iraq and the Regional Mine Action Centre, South also deserve thanks.
This project provided a blueprint regarding how collaborating can help the HMA sector in general. NPA hosted baseline TIR field trials in Al-Bussayah, southern Iraq, with logistical and technical support provided by their operations, clearance, and survey teams. Valuable technical expertise was provided by NPA specialists who provided access to CHAs, weathered targets, an open desert location to establish the study area, and security to watch over the site.
In addition, we owe special thanks to Chris Tierney, Amela Balic, Chris Ramsden, Nigel Rees, Jameel Husein, Edris Kamel, Haider Layim, Mustafa Khazly, Oussama Merhi, and the entire HI teams in Baghdad and Erbil who made work in Iraq possible. Not forgetting Scott Willan, our Australian scientific adviser.
 John Fardoulis
Project Partner
Mobility Robotics (AU) and Fardoulis Robotics (UK)
John Fardoulis is a scientist, remote-sensing practitioner, advanced UAV/small drone mapping instructor, and aerospace engineer specializing in “methodology design,” field deployment, capacity building, and applied research into the use of small drones for humanitarian purposes in hazardous environments. He is the UAV and sensor specialist on the HI Odyssey2025 Project. Fardoulis has a Bachelor of Business from the University of Western Sydney and a MSc in Aerospace Engineering from the University of Bristol.
 Xavier Depreytere
Innovation Project Manager
Humanity & Inclusion
Xavier Depreytere joined HI in 2018 after working in industry as an automation project engineer. He is currently in charge of the strategy and the coordination of the HI Odyssey2025 Project, which aims at deploying drones to facilitate and accelerate NTS and TS in Iraq and Lebanon. Xavier holds a masters in biosystems engineering from the University of Mons, Belgium.
 Jonathon Guthrie
Global Director of Operations
Norwegian People’s Aid
Jonathon Guthrie served in the Australian Army for twelve years as military engineer in explosive ordnance disposal. Since 2004 he has worked in a variety of mine action roles and countries, from Technical Field Manager through to Country Director and Technical Advisor, employed in South East Asia, the Middle East, and Eastern Europe/Central Asia. He is currently the Global Director of Operations for Norwegian People’s Aid.