
JMU students team up to help the Red Cross
News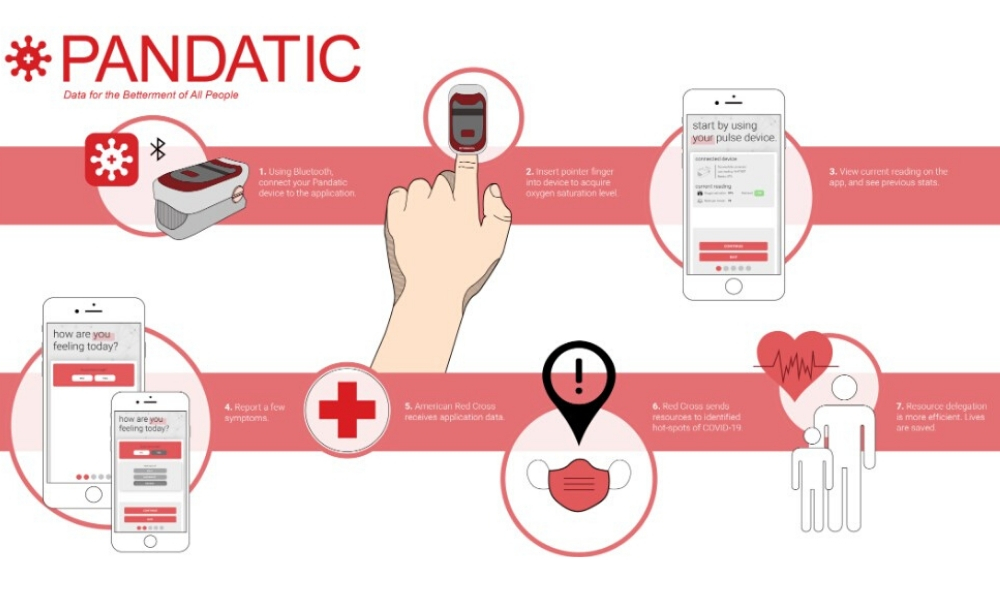
SUMMARY: Students from ISAT, CS, and Industrial Design team up to help the Red Cross tackle COVID-19.
By Lianne Boxley, CISE student writer
In January, as part of a course focused on the “Internet of Things,” students from Integrated Science and Technology, Computer Science, and Industrial Design began building a sensor to help the Red Cross improve their data collection for natural disasters in flood-prone communities.
After conducting research, creating prototypes, and sharing their progress with experts in emergency preparedness, the project was brought to a halt when a new kind of natural disaster rocked the world – the COVID-19 pandemic.
"The way we saw it, those pandemics [or] any kind of disease outbreak, is really a natural disaster in the same league as earthquakes and wildfires," says Mitch Donohoe, a senior industrial design major responsible for the visual design aspect of the project. "We saw the research we had already done as perfectly applicable to what was going on around the world."
After witnessing the challenges healthcare organizations faced with identifying outbreak ‘hot spots’, the team unanimously decided to pivot the focus of their project to COVID-19 data collection. The team’s goal is to utilize user data to help healthcare and emergency preparedness organizations identify potential locations of future outbreaks. They've spent the remainder of their spring semester creating two pieces of technology that can make that happen.
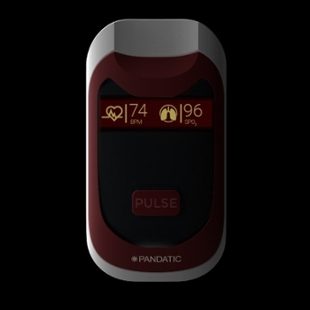 “Oxygen saturation is a pretty indicative piece of evidence for COVID-19 diagnoses. We’re creating an app and a small internet-connected pulse oximetry device that users will use to determine their oxygen saturation. Then that anonymous data will be collected and used to create a map,” explains Donohue.
These maps signify regions containing large amounts of people with low oxygen saturation - a key indicator for a COVID-19 diagnosis. Healthcare organizations can use these maps to make informed decisions on where to send testing kits, PPE, and other supplies.
“Right now, the best way of guessing the proliferation of COVID-19 is to look at the lab-confirmed test results, but those tests take time. By the time tests confirm an outbreak or 'hot spot', [the outbreak] is already well underway," says Donohue. "If users across the country were able to use a simple application and self-volunteer some key data, you could begin to identify trends and 'hot spots' before those users are in critical condition and healthcare institutions are overwhelmed."
The five students combined their skills to create a 3D prototype of the pulse oximetry device and the smartphone application. They intend to present their prototyped version of the project to the Red Cross, where they can inspire them and similar healthcare organizations to turn this into a real product. “There’s a lot that we can do to show our vision,” says Donohue. “We’re going to be able to say, ‘Here's the 3D model, here's the rough app, with six months and funding, this is what this project could look like.’”
“This project shows the power of interdisciplinary teams in addressing challenging problems,” notes Bob Kolvoord, Dean of JMU’s College of Integrated Science and Engineering. “By combining the knowledge and experience of students from three different majors, the Red Cross gets a better product and the students get real-world experience. These projects are central to our curriculum and we’re honored to count the Red Cross as a partner.”